


The cross-border spillover effects of shifts in U.S. monetary policy have long been a focus of academics and policymakers alike. A common finding in the literature is that changes in the stance of U.S. monetary policy have sizable effects on economic activity and financial markets in emerging market economies (EMEs). In this post, we analyze one specific aspect of these spillovers: how EMEs fared through the U.S. monetary policy tightening cycle of 2022-23 relative to the predictions of a model, which was calibrated to capture empirically relevant features of these economies based on historical data. We find that more vulnerable EMEs fared better in both financial market and growth outcomes than would be expected from our model, while the relatively less vulnerable fared a bit better than the model predictions for financial outcomes but substantially worse for growth outcomes.
The Shift to Tighter U.S. Monetary Policy
As shown in the left panel of the chart below, the recent tightening cycle was unprecedented in both magnitude and speed, with a cumulative rise in the federal funds rate not seen in the previous thirty years. The right panel of the chart shows that market expectations of the fed funds rate path shifted upwards by 4 percentage points between late 2021 and late 2023, with the bulk of the moves occurring in 2022. Given the history of large spillovers to EMEs, it is important to know how resilient these economies have been to this recent aggressive U.S. tightening and the accompanying rise in market expectations of the U.S. policy rate.
Market Expectations of the Federal Funds Rate Path Shifted Upwards by 4 Percentage Points Between Late 2021 and Late 2023
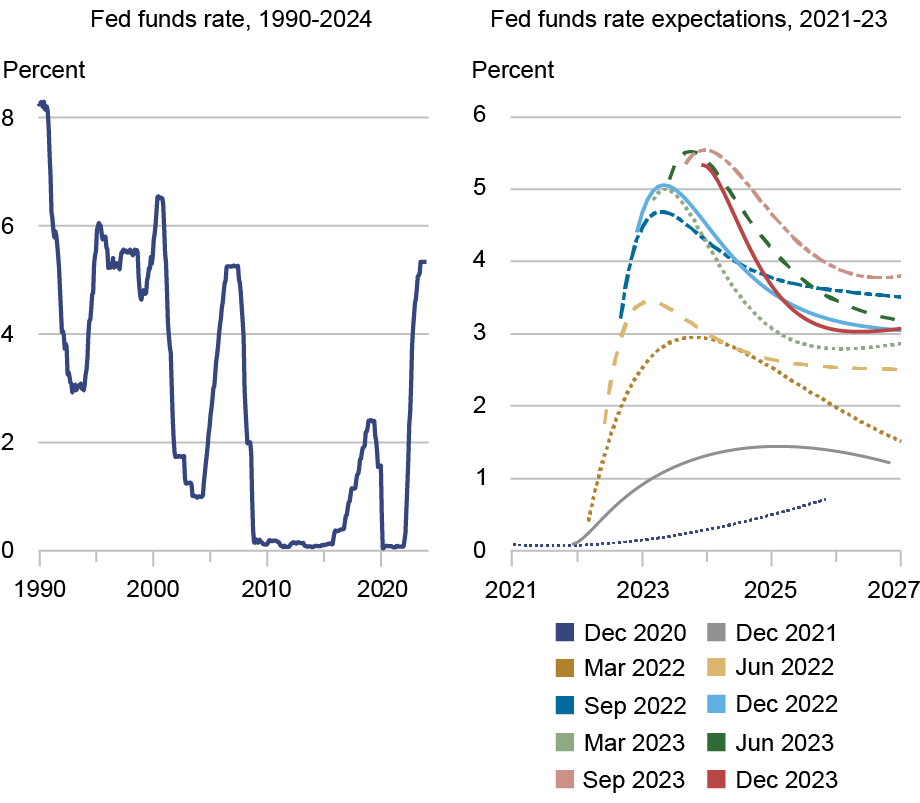
Notes: The left panel shows the level of the federal funds rate. The right panel shows market expectations of the future path of the fed funds rate implied by overnight interest swaps at each of the months indicated in the legend.
Model-Inferred Mix of Growth and Monetary Shocks
Our baseline framework is a two-country New Keynesian model consisting of a home country (a small EME) and the foreign economy (the United States). Here we present only a brief overview of our model—full details can be found in our recent research.
Two of the sources of EME vulnerability play a particularly important role in our analysis. The first is the presence of foreign currency-denominated debt in firms’ balance sheets, which leads to adverse financial consequences from domestic currency depreciation that, in principle, can more than offset the positive effects through net exports of such depreciation (modeled as in our earlier research). The second is the imperfect anchoring of inflation expectations—a property typical of EMEs with histories of high-inflation episodes and earlier absence of inflation targeting frameworks. In the model, we incorporate this feature by postulating that firms rely on past inflation surprises to guide their price-setting decisions rather than being entirely forward-looking as in the case of well-anchored long-term inflation expectations. This is a simple way to capture the idea that in some EMEs the central banks’ inflation targets lack full credibility.
Previous research argued that monetary tightening has less adverse consequences when reacting to strong aggregate demand (growth shocks) than heightened inflation pressures (monetary shocks). This feature reflects that U.S. aggregate demand shocks have positive spillovers to other countries that would offset some of the adverse effects from higher U.S. interest rates.
We use our model to infer a specific mix of positive growth and adverse monetary shocks driving the U.S. tightening, assuming that these two shocks were the only shocks driving the dynamics of the fed funds rate and U.S. GDP. Here we use the feature that these two shocks would drive U.S. GDP in opposite directions. Using a measure of the shift in market participants’ expectations of U.S. growth, along with the shifts in the expected path of the fed funds rate shown earlier, we can infer from the model the specific combination of growth and monetary shocks that drove the tightening.
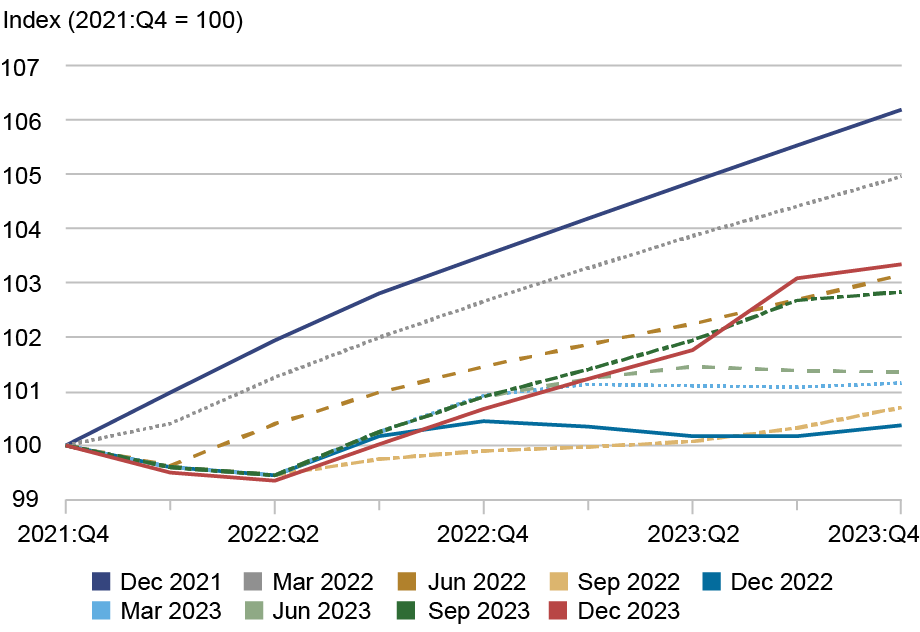
The chart below shows the evolution of a survey-based measures of U.S. quarterly real GDP growth expectations of financial analysts, obtained from the Blue Chip Economic Indicators. It shows progressive markdowns to expected growth through almost all of 2022 that occurred while expectations of the fed funds rate (shown earlier) were being revised up. This suggests that over this period inflation concerns were the dominant factor driving monetary policy, even though starting in December 2022, growth expectations started to be revised upward.
U.S. Real GDP Expectations Were Marked Down over Much of 2022
Predicted vs. Realized Effects on Financial Markets and Real Activity
Next, we turn to the question of how the actual evolution of financial variables and real activity in less and more vulnerable emerging economies over this tightening period compares with the model’s predictions for the inferred combination of growth and monetary shocks. EMEs are divided into less vulnerable and more vulnerable groups based on a methodology that compares a cross-country vulnerability index presented in this research.
The panel chart below shows the evolution of EME corporate borrowing spreads (top row) and EME nominal exchange rates (bottom row) for less and more vulnerable EMEs (left and right columns, respectively). The light blue lines show the model’s predictions when the U.S. tightening is completely growth-driven while the red lines show the case when it is completely monetary-driven. The dashed green lines show the predictions of the model from the model-inferred combination of growth and monetary shocks. The model-implied paths are constructed by assuming that absent shocks, spreads and exchange rates would have remained constant at their 2021:Q4 levels. The actual data are shown by the dark blue lines.
Financial Spillovers During the Recent U.S. Tightening Cycle Matched Predictions for Less Vulnerable EMEs but Were Smaller Than Expected for More Vulnerable Ones
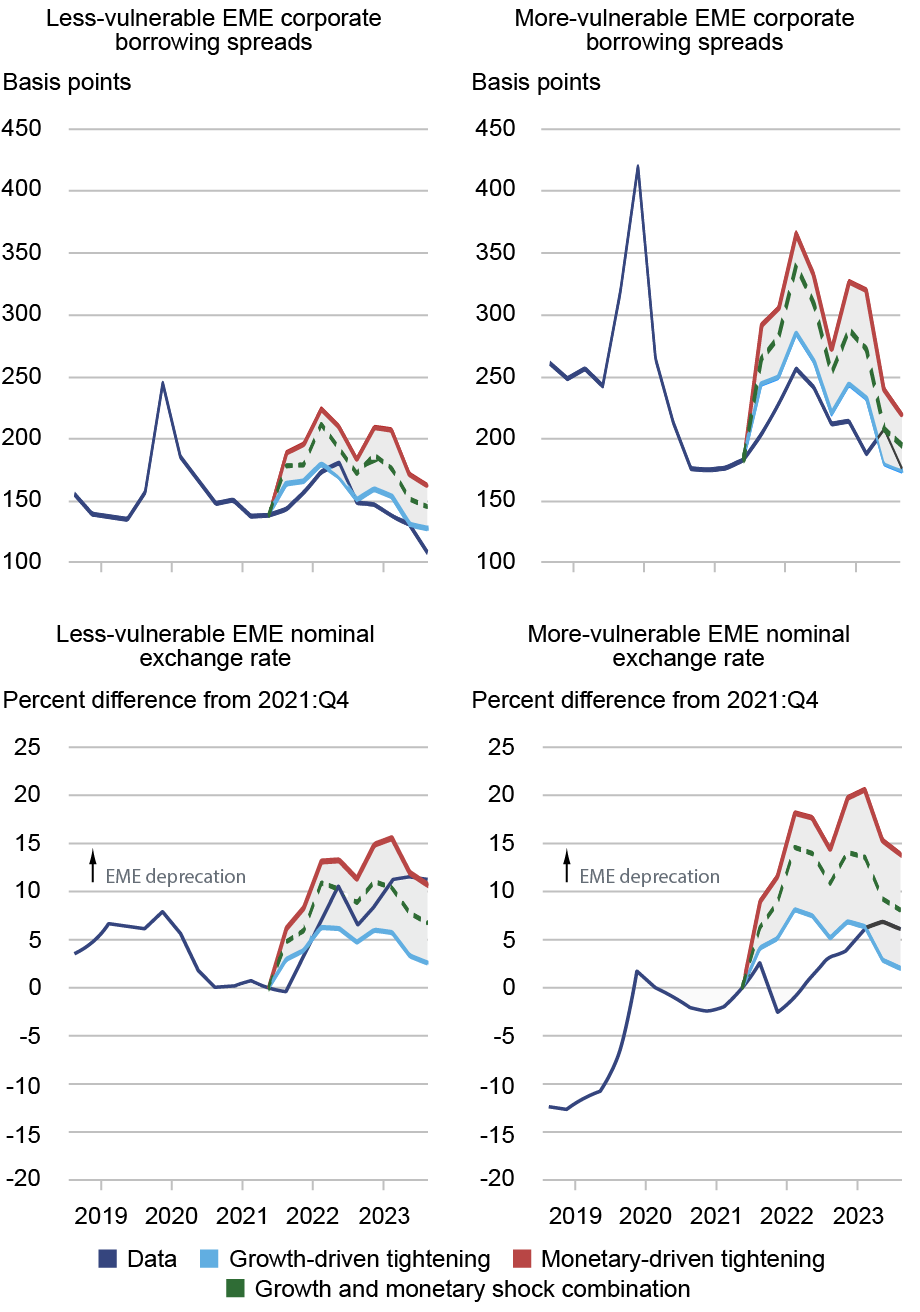
Notes: Corporate borrowing spreads are five-year triple-B corporate bond spreads issued by corporations in Asian EMEs proxying less vulnerable EMEs and by corporations in Latin American EMEs proxying for more vulnerable EMEs. The exchange rate aggregate for the less vulnerable EMEs draws on data for China, Indonesia, Israel, Malaysia, South Korea, Taiwan, Thailand, and Vietnam and for the more vulnerable EMEs on Argentina, Brazil, Chile, Colombia, India, Mexico, Philippines, and Russia. Values are weighted using GDP purchasing power parity weights.
For the less vulnerable EMEs, exchange rates (bottom left panel) behaved largely as the model predicted, showing significant depreciations consistent with historical patterns. In these same economies, the level of corporate spreads was lower than what was suggested by the identified combination of shocks through the lens of our model, and close to the path implied by assuming growth shocks only. In contrast, for the more vulnerable economies, the level of financial stress since early 2022 was considerably lower than suggested by the growth-monetary shock combination through the lens of our model, and close to the path implied by assuming growth shocks only—a condition that indicates they fared better than expected.
Turning to real activity, the message is roughly the same when looking at the behavior of real GDP levels, as shown in the chart below. Here the predicted outcomes are generated by assuming that absent shocks GDP paths of EMEs would have followed the path indicated by private sector forecasts as of 2021:Q4, shown by the dashed-dotted lines. The more vulnerable EMEs (right panel) displayed remarkable resilience, with GDP levels considerably higher than the model-implied path from the growth-monetary shock combination. In contrast, the less vulnerable EMEs (left panel) saw GDP outcomes well below those predicted from the growth-monetary shock combination and very close to those implied by assuming monetary-driven tightening only.
More Vulnerable EMEs Showed GDP Resilience While Less Vulnerable Ones Underperformed During the Recent U.S. Tightening Cycle
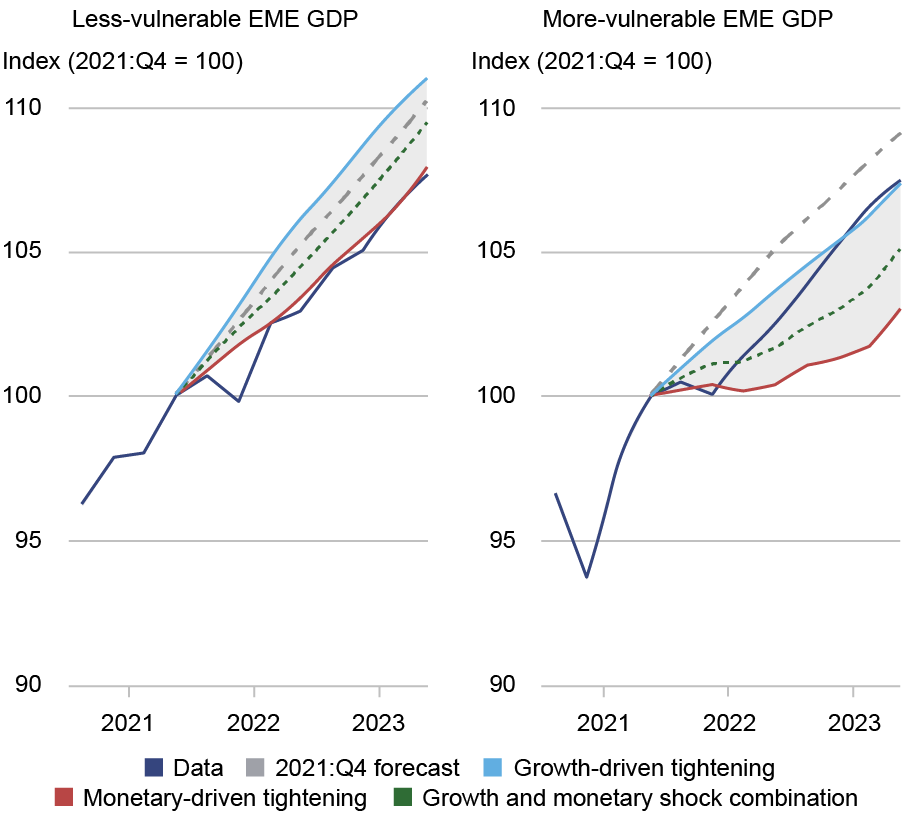
Note: Less and more vulnerable groups are made up of the same countries as in the exchange rate aggregates above.
Overall, our evidence suggests that both groups of EMEs fared better in financial markets than the model predicted, with more vulnerable economies outperforming by an especially large margin. The picture for economic activity was more mixed: more vulnerable economies did considerably better than predicted, while less vulnerable economies did substantially worse.
What Might Explain These Divergent Outcomes?
One possible interpretation of the divergence in outcomes is that developments outside of the United States—such as movements in global commodity prices and China’s growth prospects—affected more-vulnerable and less-vulnerable EMEs differently, yet these factors are not incorporated in our model. Alternatively, more vulnerable EMEs may have strengthened their monetary and other policy frameworks in ways not yet reflected in the vulnerability index variables.

Shaghil Ahmed is deputy director in the Federal Reserve Board’s Division of International Finance.

Ozge Akinci is head of International Studies in the Federal Reserve Bank of New York’s Research and Statistics Group.

Albert Queralto is chief of the Global Modeling Studies Section in the Federal Reserve Board’s Division of International Finance.
How to cite this post:
Shaghil Ahmed, Ozge Akinci, and Albert Queralto, “How Resilient Were Emerging Market Economies Through the 2022‑23 U.S. Monetary Tightening Cycle?,” Federal Reserve Bank of New York Liberty Street Economics, June 26, 2026, https://doi.org/10.59576/lse.20260626
BibTeX: View |
Disclaimer
The views expressed in this post are those of the author(s) and do not necessarily reflect the position of the Federal Reserve Bank of New York or the Federal Reserve System. Any errors or omissions are the responsibility of the author(s).