


Current discussions regarding a bifurcated U.S. economy highlight the increasing economic divide between lower- and higher-income Americans in spending and earnings growth and wealth accumulation. While many households are doing fine and economic activity overall has been expanding at a solid pace, large segments of the population are facing high levels of economic insecurity and financial strain, and consumer sentiment on the whole has dropped to low levels. In this post, we use newly collected data from the Survey of Consumer Expectations (SCE) to update our 2020 analysis of disproportionate financial hardship experienced during the early pandemic and to investigate recent changes in food insecurity and broader economic strains. We then examine how food insecurity relates to the increase in consumer pessimism. We find a remarkable increase in food insecurity, particularly among lower-educated and lower-income households and households with young children. We document a contemporaneous increase in pessimism among the same groups, along with a sharp decline in job-finding expectations.
Declining Consumer Sentiment in a K-Shaped Economy
Despite solid economic fundamentals (low unemployment, historically high household net wealth, and resilient consumer spending), consumers overall have been pessimistic about their own financial circumstances and outlook. Current levels of consumer sentiment, capturing how optimistic consumers are about their personal finances and the overall economy, have fallen near or below the low levels seen during the Great Recession and pandemic.
These macroeconomic indicators mask significant heterogeneity across households, supporting the notion of a “K-shaped” economy, in which consumption growth in recent years has been driven largely by higher-income and college-educated households while lower-income households have seen fewer gains. The top of the K-shape reflects high and growing levels of net wealth, fueled by rising stock prices, near-peak home equity levels, and reductions in mortgage payments following the 2020-21 refinance boom. The bottom of the K-shape represents a significant share of the middle- and lower-income population experiencing elevated levels of economic uncertainty and financial hardship. Such financial stress is reflected in concerns about affordability due to the high cost of living, persistent inflation, and high interest rates, and in high delinquency rates for credit cards and auto and student loans.
Lower- and middle-income households generally have experienced higher effective inflation rates, with a greater share of their spending allocated to goods that have seen prices soar since the pandemic, such as housing, groceries, and utilities, causing them to cut back on groceries. The greater financial strain due to the high cost of living, combined with the expiration of pandemic-era aid (such as expanded SNAP benefits), have led to renewed concerns about food insecurity among those at the bottom of the K-shape.
New Evidence from the Survey of Consumer Expectations
To provide further recent evidence on financial and food insecurity, we draw on the SCE. The SCE is a monthly internet-based survey that has been conducted by the Federal Reserve Bank of New York since June 2013. It is based on a twelve-month rotating panel of roughly 1,200 nationally representative U.S. household heads. As part of its May and June 2020, October 2025, and February 2026 surveys, the SCE included a set of targeted questions to study household financial stress and food insufficiency, as well as households’ expectations about their financial situation a year from now.
Specifically, we asked household heads whether they (or someone in their household) experienced any of the following four events over the prior three months: dipped into savings or emergency accounts to cover expenses; had trouble finding enough food to eat or had kids who missed meals; received food donations from family, friends, or food banks; or received aid through SNAP. Note that eligibility for SNAP benefits is based on household income and size, and is an imperfect proxy for food insecurity. In our analysis, we pool data from the two 2020 surveys and refer to it as the June 2020 survey.
As shown in the charts below, since May/June 2020, and also between October 2025 and February 2026, there have been meaningful increases in the shares of households reporting that they’d experienced the four situations described above. The increases were mostly broad-based across race, age, income, and education groups, but were generally larger for non-whites, lower-income and lower-educated households, and households with children, as detailed in the chart.
Broad-Based Increases in Food Insecurity and Broader Economic Strains Since 2020
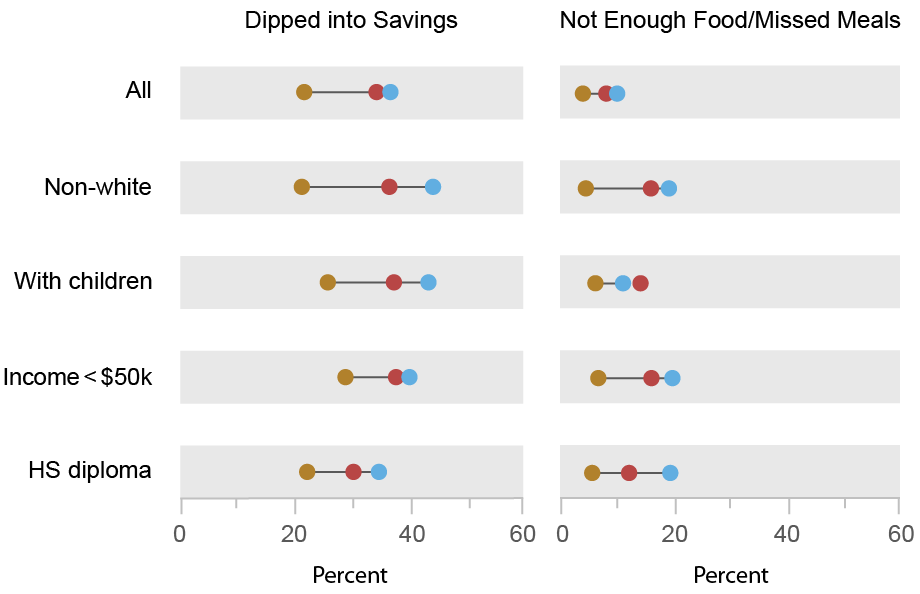
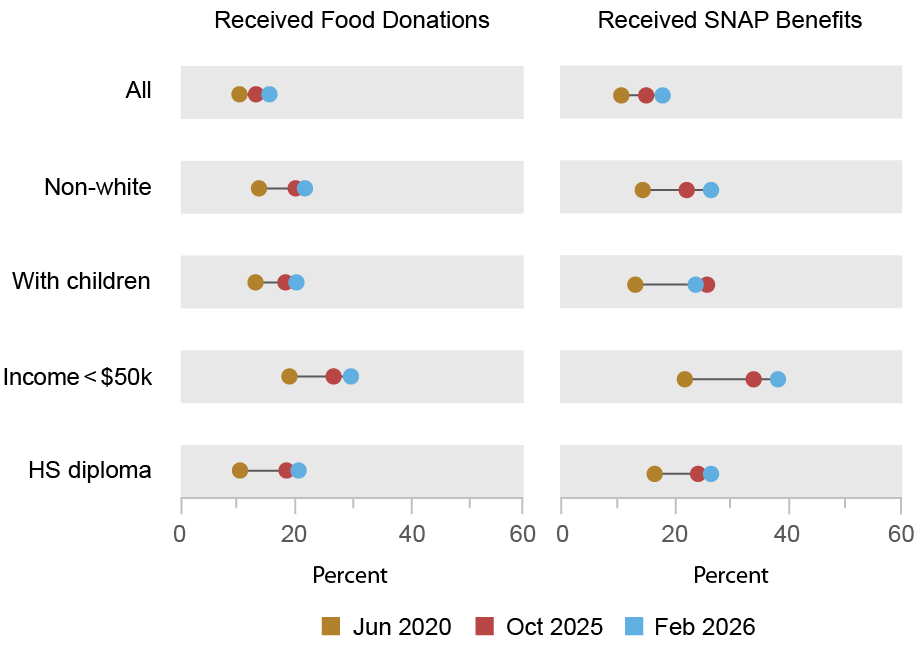
Notes: The chart shows the shares of respondents in the four surveys (May 2020 and June 2020 results are grouped as June 2020) who reported that over the previous three months they (or someone in their household) had dipped into savings and emergency accounts to cover expenses; had trouble finding enough food to eat or had kids who missed meals; received food donations from family, friends, or food banks; or received aid through SNAP.
While related, our measures differ from the U.S. Department of Agriculture’s (USDA) official survey measure of food insecurity, which aims to capture “the limited or uncertain availability of nutritionally adequate and safe foods, or limited or uncertain ability to acquire acceptable foods in socially acceptable ways.” The USDA’s measure of food insecurity for 2024, its most recent survey, stood at 13.7 percent of households (18.4 percent among households with children). The rate is the highest since reaching a post-2001 low of 10.2 percent in 2021 but remains below its post-2001 high of 14.9 percent attained in 2011. Food insecurity is associated with poor health outcomes as well as lower educational attainment, worker productivity, and lifetime earnings.
Increased Food Insecurity Is Also Associated with Declining Consumer Sentiment
In addition to the increasing trend in these shares, we find that among those reporting incidents of food insufficiency (not enough food, received food donations) and SNAP receipt, there is a lower, and more rapidly declining, net share of respondents expecting to be better versus worse off financially a year from now (as shown in the table below). This means that an increase in the incidence of food insecurity is associated with a deterioration in consumer sentiment. However, the increase in food insecurity clearly is not the only factor that matters—even among those not reporting these incidents of food insecurity we find a sizable decline between 2020 and October 2025 in the net share of respondents expecting to be better versus worse off a year from now, though this decline was followed by partial reversal from October 2025 to February 2026.
Food Insecure Households Report Greater Pessimism on the Economy, Labor Market, and Debt
| Household expectations | May/June 2020 | October 2025 | February 2026 |
| Net share better/worse off | 8.0 | -4.2 | –0.6 |
| – Not enough food/skipped meals | -10.2 | -22.1 | -32.5 |
| – Received food donations | 0.8 | -14.8 | -22.7 |
| – Received SNAP benefits | 0.4 | -0.2 | -11.7 |
| Average job-finding probability, if were to lose job | 48.0 | 46.8 | 44.0 |
| – Not enough food/skipped meals | 48.8 | 37.2 | 41.4 |
| – Received food donations | 48.6 | 37.0 | 39.4 |
| – Received SNAP benefits | 50.1 | 36.7 | 33.7 |
| Average debt delinquency probability | 11.2 | 13.1 | 11.6 |
| – Not enough food/skipped meals | 41.4 | 41.8 | 32.3 |
| – Received food donations | 23.4 | 30.1 | 23.4 |
| – Received SNAP benefits | 19.6 | 31.1 | 20.3 |
Notes: The top panel of the table shows the net share of respondents expecting their household to be financially better versus worse off twelve months from now, overall and for those reporting food need and assistance, in the May/June 2020, October 2025, and February 2026 surveys. The middle panel shows, for each subgroup and survey wave, the average reported percentage chance of finding a job within the following three months, if one’s job were to be lost today. The bottom panel shows the average reported probability of, over the next three months, not being able to make a minimum debt payment. See the SCE questionnaire for the exact question wordings.
Interestingly, we also find considerably larger reductions in the expected job-finding rate (measured as the probability of finding a job in the next three months if one’s current job is lost) for those reporting food needs or SNAP receipt. In contrast, we see little movement over the period in debt delinquency expectations, which measures the probability of missing a minimum debt payment within the next three months—although it’s worth noting that respondents who experience food insecurity have significantly higher debt delinquency expectations. Overall, these trends point to a deterioration in sentiment or an increased pessimism among those who report food insecurity and SNAP receipt.
While not necessarily causal, the observed positive association between food insecurity and overall consumer pessimism, together with the increase in the incidence of food insecurity, especially among households at the bottom of the K-shape, point to a potential explanation for the unusually low recent levels of consumer sentiment at a time when the hard economic data paint a more positive picture.

Gizem Kosar is an economic research advisor in the Federal Reserve Bank of New York’s Research and Statistics Group.

Ishva Mehta is a research analyst in the Federal Reserve Bank of New York’s Research and Statistics Group.

Wilbert van der Klaauw is an economic research advisor in the Federal Reserve Bank of New York’s Research and Statistics Group.
How to cite this post:
Gizem Kosar, Ishva Mehta, and Wilbert van der Klaauw, “Food Insecurity and Consumer Pessimism,” Federal Reserve Bank of New York Liberty Street Economics, May 27, 2026, https://doi.org/10.59576/lse.20260527
BibTeX: View |
Disclaimer
The views expressed in this post are those of the author(s) and do not necessarily reflect the position of the Federal Reserve Bank of New York or the Federal Reserve System. Any errors or omissions are the responsibility of the author(s).
