


A succession of shocks to the global economy in recent years has focused attention on the improved economic and financial resilience of emerging market economies. For some of these economies, this assessment is well-founded and highlights the fruits of deep, structural economic reforms since the 1990s. However, for a much larger universe of countries, the ability to weather shocks is still mixed and many remain vulnerable. In this post, we explore the divide between the two sets of countries and focus on the effects of recent economic shocks, including the ongoing conflict in the Middle East.
Defining Emerging Markets
There is no official definition of what constitutes an emerging market (EM) economy, but the term is often associated with a country’s level of per capita income, exports of goods and services, and integration into the global financial system. It is also a financial market convention used for asset allocation, risk assessment, and index inclusion. A common market reference, the MSCI Emerging Market Index, includes twenty-four mostly middle-income economies with liquid bond and equity markets, but excludes the much larger swath of developing countries that represent a significant share of the world’s population, including a disproportionate share of the world’s poorest countries.
For comparison, we segment emerging markets into two groupings. We consider “Core” emerging markets to be those countries included in the MSCI Index (excluding advanced economies South Korea and Taiwan). More broadly, our “Periphery” emerging markets comprise ninety-two countries that fall outside the MSCI Index. The latter group excludes both countries that are in sustained large-scale armed conflict and small island states that lack access to international sovereign bond markets.
As highlighted in the table below, Core EMs have more than doubled their share of the world economy over the past twenty-five years, with much of that growth attributable to China’s remarkable (albeit uneven) development. Over the same period, Periphery EMs’ share of global GDP has remained stagnant, while their share of world population has grown, widening the wealth gap in per capita terms. Excluding China and India, the Periphery countries have a substantially larger share of the world’s population than the Core countries.
Stark Differences Between Core and Periphery Emerging Markets
| Core EMs | Periphery EMs | |||||
| 22 countries | Ex. China & India | 92 countries | ||||
| Share of global: | 2000 | 2025 | 2000 | 2025 | 2000 | 2025 |
| GDP | 14% | 33% | 9% | 13% | 6% | 6% |
| Gov’t debt | 7% | 26% | 5% | 7% | 2% | 7% |
| Population | 55% | 52% | 17% | 17% | 22% | 27% |
Notes: Core EMs include Brazil, Chile, China, Colombia, Hungary, India, Indonesia, Kuwait, Malaysia, Mexico, Morocco, Peru, Philippines, Poland, Qatar, Romania, Saudi Arabia, South Africa, Thailand, Turkey, U.A.E., and Vietnam. Periphery EMs exclude countries that meet the UCDP definition of being at “war” and UN-defined small island developing states that are not in the JP Morgan EMBI Index.
How Core EMs Built Resilience
The improved resilience of Core EM economies reflects the sustained period of macroeconomic and institutional reform that began after the crises of the 1990s. At that time, many governments faced high exposure to foreign currency liabilities, limited foreign exchange reserves, and weak monetary policy frameworks, leaving them vulnerable to capital flow reversals. Over subsequent decades, Core EMs implemented reforms aimed at reducing these vulnerabilities and strengthening policy credibility.
A central reform has been the reduction in reliance on foreign currency borrowing. Historically, EMs had little option but to issue debt primarily in U.S. dollars (i.e., “original sin”), exposing their public finances to exchange rate movements. Core EMs gradually expanded their domestic capital markets and broadened their local investor base, enabling governments to issue a larger share of debt in domestic currency. As shown in the upper left panel of the chart below, while foreign currency debt exposure fluctuated, it declined on net for Core EMs over the past twenty years and remained at relatively low levels compared to Periphery economies, where exposure remained significantly elevated.
Core EMs also strengthened external buffers through sustained foreign exchange reserve accumulation. Their median reserve buffers have risen significantly in recent decades, providing greater capacity to absorb external shocks and allowing exchange rates to adjust. The upper right panel of the chart below illustrates this widening gap: Core EMs entered recent global shocks with substantially higher reserve coverage than Periphery economies.
Institutional reforms reinforced macroeconomic improvements. Core EMs enhanced central bank independence and clarified policy mandates, contributing to better anchored inflation expectations. As shown in the bottom left panel of the chart below, Core EMs experienced a smaller inflation spike and a faster return toward pre-pandemic levels. This performance contrasts with Periphery economies, where inflation remained elevated for longer.
Finally, financial markets reflected these differences through sovereign borrowing costs. The bottom right panel of the chart below shows a lower cost of sovereign borrowing for Core EMs even in the aftermath of recent global shocks (e.g., the pandemic and global monetary tightening), while Periphery EM sovereign credit spreads (above U.S. Treasury securities) remained elevated.
Core EMs’ Larger Buffers Lead to Better Outcomes Compared to Periphery EMs
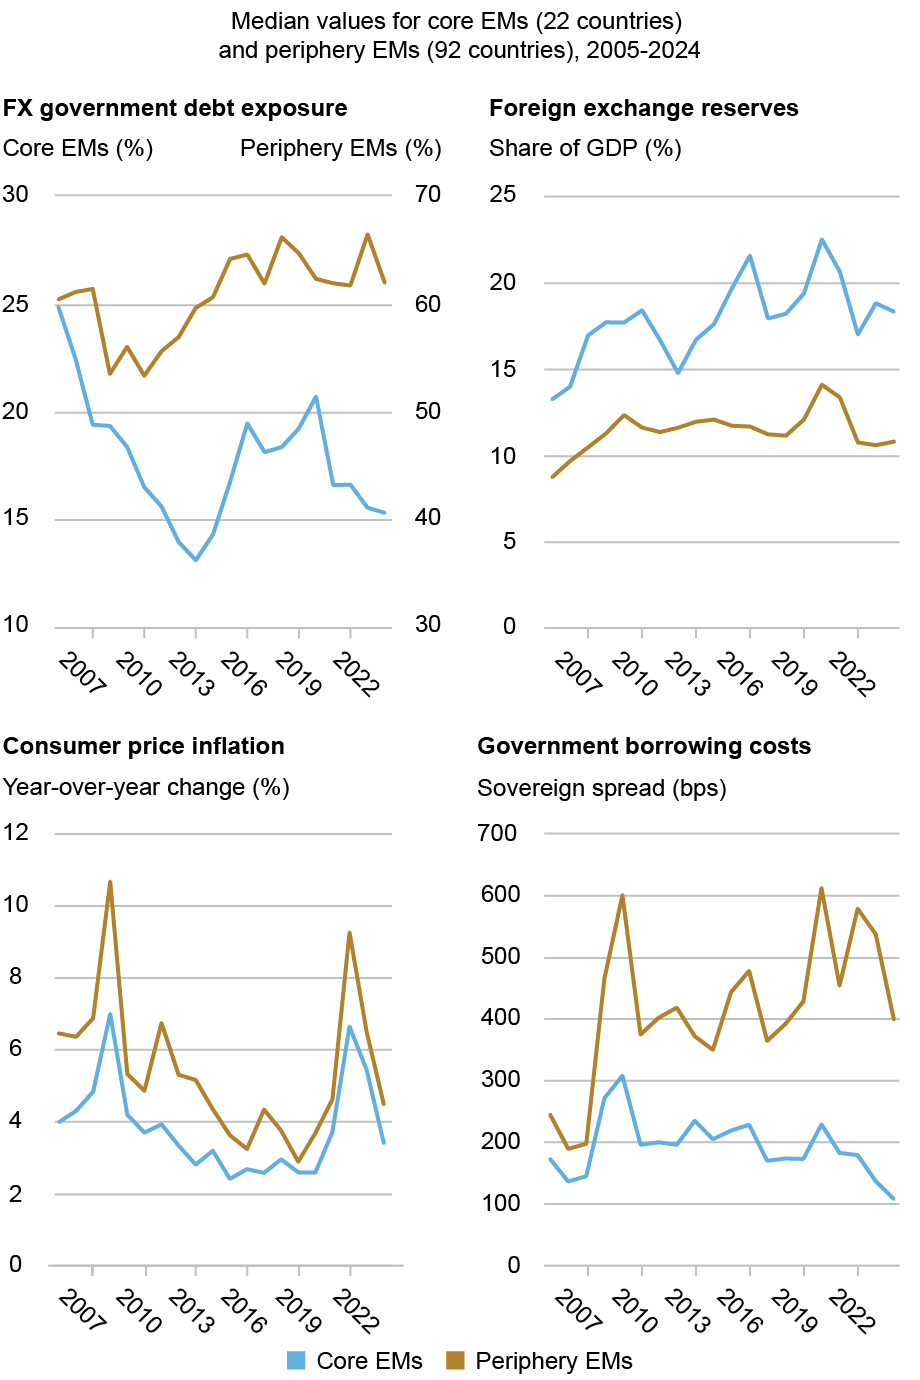
Notes: Sovereign spreads are measured by U.S. dollar-denominated debt over U.S. Treasuries. Periphery borrowing costs and foreign currency share of government debt may be understated due to limited international market access and data availability.
The Policy Dilemma Facing Periphery Economies
Many Periphery economies still borrow predominantly in foreign currencies, hold lower levels of foreign exchange reserve buffers, and have central banks that investors view as less credible. When global risk appetite shifts, capital outflows from emerging markets typically lead to currency depreciations. In economies with significant reliance on foreign currency borrowing, this depreciation tightens financial conditions by straining government and private-sector balance sheets and raising debt servicing costs. For many Periphery EMs, policymakers are still unable to react to a shock with countercyclical policy (i.e., monetary policy easing or fiscal expansion) due to concerns over inflation and financial stability. Often authorities in these countries tighten policies or sell foreign exchange reserves to defend the currency, often worsening output losses (i.e., “fear of floating”).
Comparing Emerging Market Resilience During and After the Pandemic
Recent global shocks highlight the divergence in resilience between Core and Periphery EMs. We focus on the respective sovereign borrowing costs during risk-off periods around COVID and the ensuing global monetary tightening and supply shocks of 2022. The upper left panel of the chart below illustrates substantially larger increases in borrowing costs (as measured by changes in median sovereign bond spreads over U.S. Treasury securities) among Periphery EMs during both shocks.
In the upper right panel, we also consider changes in sovereign borrowing costs since the onset of the most recent conflict in the Middle East. The median sovereign spread across Periphery EMs has increased by 45 bps from February 27 to 332 bps, whereas the median spread on Core EM debt has increased by only 4 bps over the same period.
Sovereign credit ratings tell a similar story. These ratings measure the default probability of government borrowers by considering a country’s economic, policy, and institutional strengths, making them a natural barometer of structural resilience. In the chart below, the lower panel shows Periphery EMs with larger and more widespread credit rating downgrades relative to their Core counterparts and slower, less pronounced upgrades since 2023. Sovereign borrowing costs and credit ratings matter because they directly affect market access and refinancing risks. Higher spreads and downgrades raise the cost of rolling over existing debt and can limit access to external financing when funding needs are greatest.
Periphery EMs Faced Larger Borrowing Cost Spikes and Steeper Credit Rating Downgrades in Recent Shocks
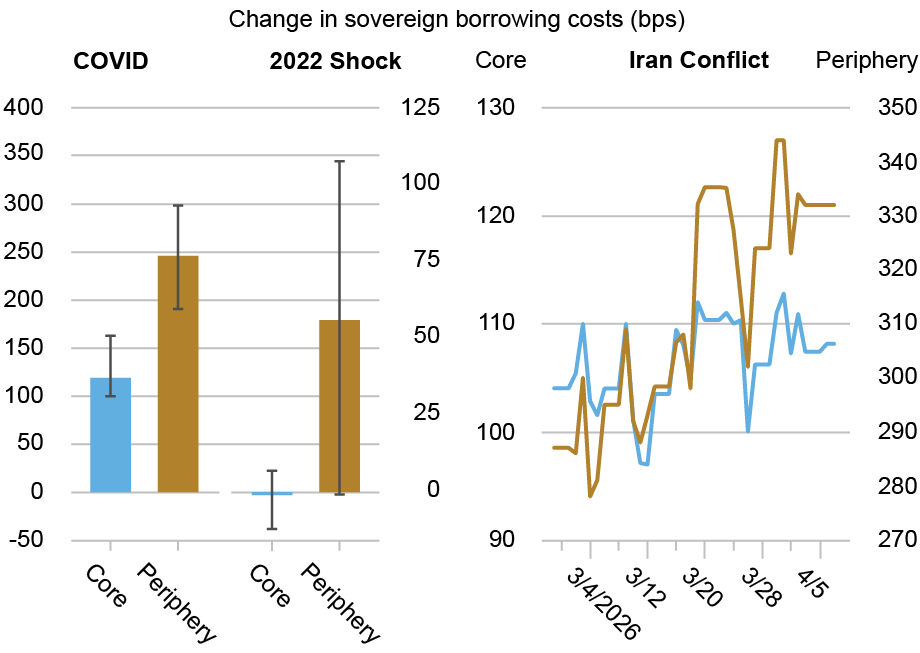
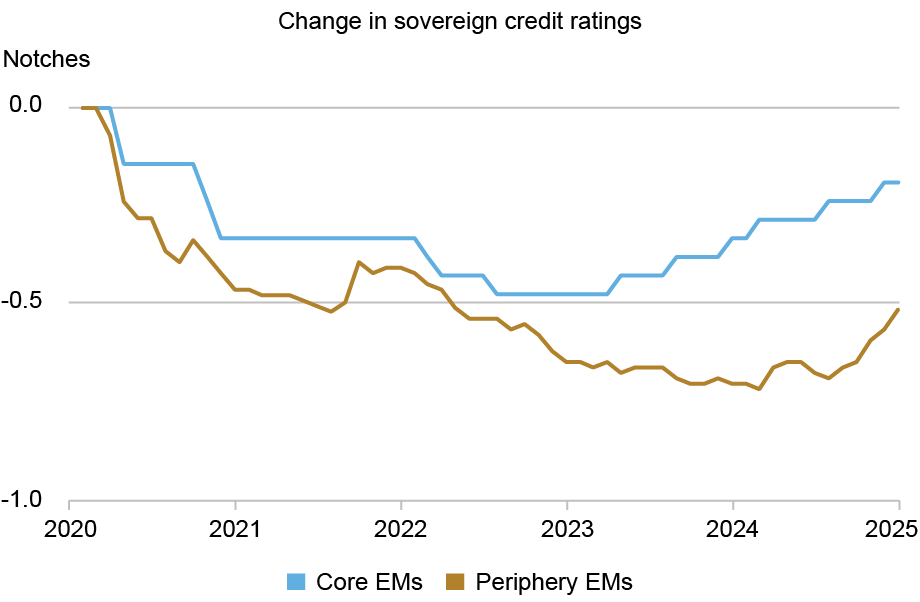
Notes: The upper left panel shows the median spread change (in basis points) from the day before each of two shocks. The COVID shock has a baseline date of January 22, 2020 (the day before the Wuhan shutdown) and spans January 23-April 30, 2020. The 2022 shock has a baseline date of February 23, 2022 (the day before Russia’s invasion of Ukraine) and spans February 24-May 31, 2022. Bars show the median change in sovereign spreads (episode median minus baseline day); error bars show the interquartile range (25th-75th percentile). The upper right panel shows median sovereign spreads since February 27, 2026 (the day before the outbreak of the Iran conflict). Countries in the midst of debt restructuring at the time of each episode are excluded from the relevant panels. The lower panel shows the change in mean sovereign credit ratings from a January 2020 baseline; shifts higher reflect upgrades.
The Role—and Limits—of the Global Financial Safety Net
The global financial safety net has played an important role in shaping emerging market outcomes, with Core emerging markets engaged with IMF facilities on a precautionary basis, thus reinforcing market confidence and preserving policy flexibility. By contrast, Periphery economies have more often relied on IMF support under conditions of acute stress, typically alongside rising borrowing costs and loss of market access.
These differences reflect constraints imposed by the global financial cycle and the limited ability of external financing to offset shifts in global risk appetite. Nearly half of Periphery economies accessed IMF distress financing between 2020 and 2023, often amid sharp increases in sovereign spreads and widespread credit rating downgrades. Repeated program use has been common; of the Periphery countries that have entered IMF programs since 2000, 70 percent have had to seek three or more such arrangements.
While IMF support has helped stabilize conditions during periods of stress, it has not consistently restored durable market access. This pattern is consistent with earlier evidence on IMF-supported programs and market access showing that official financing can contain crises without fully resolving underlying vulnerabilities. Since 2005, Periphery economies have recorded thirty-two sovereign defaults across seventeen countries (Argentina, Belize, and El Salvador have defaulted at least three times each), while no Core emerging market has defaulted over the same period.
Looking Forward
Recent shocks have reinforced the divide between emerging markets that have strengthened their policy frameworks and those that remain more exposed to external volatility. Core EMs have been better positioned to absorb shocks and maintain market access, while many Periphery economies continue to face difficult tradeoffs when global conditions tighten. Bridging this gap will require sustained progress in domestic policy credibility, macroeconomic stability, and shock absorption capacity. External support can ease adjustment during periods of stress, but durable resilience ultimately depends on reforms implemented at home.

Hunter L. Clark is an economic policy advisor in the Federal Reserve Bank of New York’s Research and Statistics Group.

Jeffrey B. Dawson is an economic policy advisor in the Federal Reserve Bank of New York’s Research and Statistics Group.

Julian Gonzalez-Murphy is a country risk associate in the Federal Reserve Bank of New York’s Markets Group.
How to cite this post:
Hunter L. Clark, Jeffrey B. Dawson, and Julian Gonzalez-Murphy, “A Closer Look at Emerging Market Resilience During Recent Shocks,” Federal Reserve Bank of New York Liberty Street Economics, April 9, 2026, https://doi.org/10.59576/lse.20260409
BibTeX: View |
Disclaimer
The views expressed in this post are those of the author(s) and do not necessarily reflect the position of the Federal Reserve Bank of New York or the Federal Reserve System. Any errors or omissions are the responsibility of the author(s).