

In March 2020, the Federal Reserve commenced purchases of U.S. Treasury securities to address the market disruptions caused by the pandemic. This post assesses the execution quality of those purchases by comparing the Fed’s purchase prices to contemporaneous market prices. Although past work has considered this question in the context of earlier asset purchases, the market dysfunction spurred by the pandemic means that execution quality at that time may have differed. Indeed, we find that the Fed’s execution quality was unusually good in 2020 in that the Fed bought Treasuries at prices appreciably lower than prevailing market offer prices.
The Fed’s Market Functioning Purchases
The COVID-19 pandemic triggeredmassive customer selling of Treasuries in March 2020 amidst the so-called dash-for-cash, overwhelming dealers’ capacity to intermediate flows and contributing to a marked deterioration of market functioning. The Fed took numerous steps to address the disruptions, including the launch of market functioning purchases of Treasuries and other securities. The purchases were unprecedented in their speed and scale with nearly $2 trillion of notes and bonds purchased under the program in 2020 alone, as shown below, and differed from earlier purchases in their focus on addressing market dysfunction.
Market Functioning Purchases Dwarfed Earlier Program Purchases
| Program | Operation Dates | Number of Operations | Amount Purchased |
| LSAPs— first round |
Mar. 23, 2009—Oct. 29, 2009 | 91 | $396 bn |
| LSAPs— second round |
Nov. 4, 2010—Sep. 19, 2011 | 145 | $792 bn |
| Maturity extension program | Sep. 23, 2011—Dec. 28, 2012 | 204 | $648 bn |
| LSAPs— third round |
Jan. 3, 2013—Oct. 27, 2014 | 342 | $766 bn |
| Market functioning purchases | Mar. 13, 2020—Dec. 23, 2020 | 264 | $1,969 bn |
Notes: The table reports operation dates and statistics for various Federal Reserve asset purchase programs. Amount purchased indicates the total quantity of U.S. Treasury notes and bonds purchased across all operations and is measured in billions of dollars, par value. Market functioning purchases continued into 2022, but statistics here are limited to 2020 purchases. LSAPs = Large-scale asset purchases.
The market functioning purchases were conducted like other Fed security purchases as multi-price, multi-security auctions. The New York Fed’s primary dealers are eligible to participate in such operations, submitting offers for their customers as well as themselves. Propositions are evaluated based on their proximity to prevailing market prices at the close of auction and relative-value measures. More details can be found in FAQs: Treasury Outright Operations.
Importance of Execution Quality
Although not the primary goal of Fed operations, the operations’ execution quality is of general interest because the Fed remits its excess earnings to the U.S. Treasury—after providing for operating expenses, payment of dividends, and the amount necessary to maintain surplus. It follows that every dollar the Fed saves when buying Treasury securities benefits taxpayers by one dollar. Since the Fed purchased $2 trillion in Treasury notes and bonds in 2020 alone, a savings of 15 cents per $100 of securities purchased would translate to a taxpayer benefit of $3 billion.
Execution quality also matters because it may reflect market conditions. Highly variable proposition prices across dealers could indicate uncertainty as to market prices. Operation purchase prices worse than market could suggest a high price impact from the Fed’s trades or that the dealers are not offering the Fed competitive prices. Conversely, purchase prices better than market might indicate a low price impact from the Fed’s trades or preferences of certain dealers to sell securities that are not reflected in market prices. Of note, operation results were used during the pandemic to help gauge market functioning and make decisions about future Fed purchases as discussed in this open market operations report.
Measuring Execution Quality
We measure execution quality for a given transaction by comparing the Fed’s purchase price to the prevailing market price of the associated security at the close of the operation in which the transaction took place. Details on individual transactions, including the amount traded and price, are released with a two-year lag and can be found here. Market prices are obtained from the New York Fed’s pricing database, which includes information from various pricing providers.
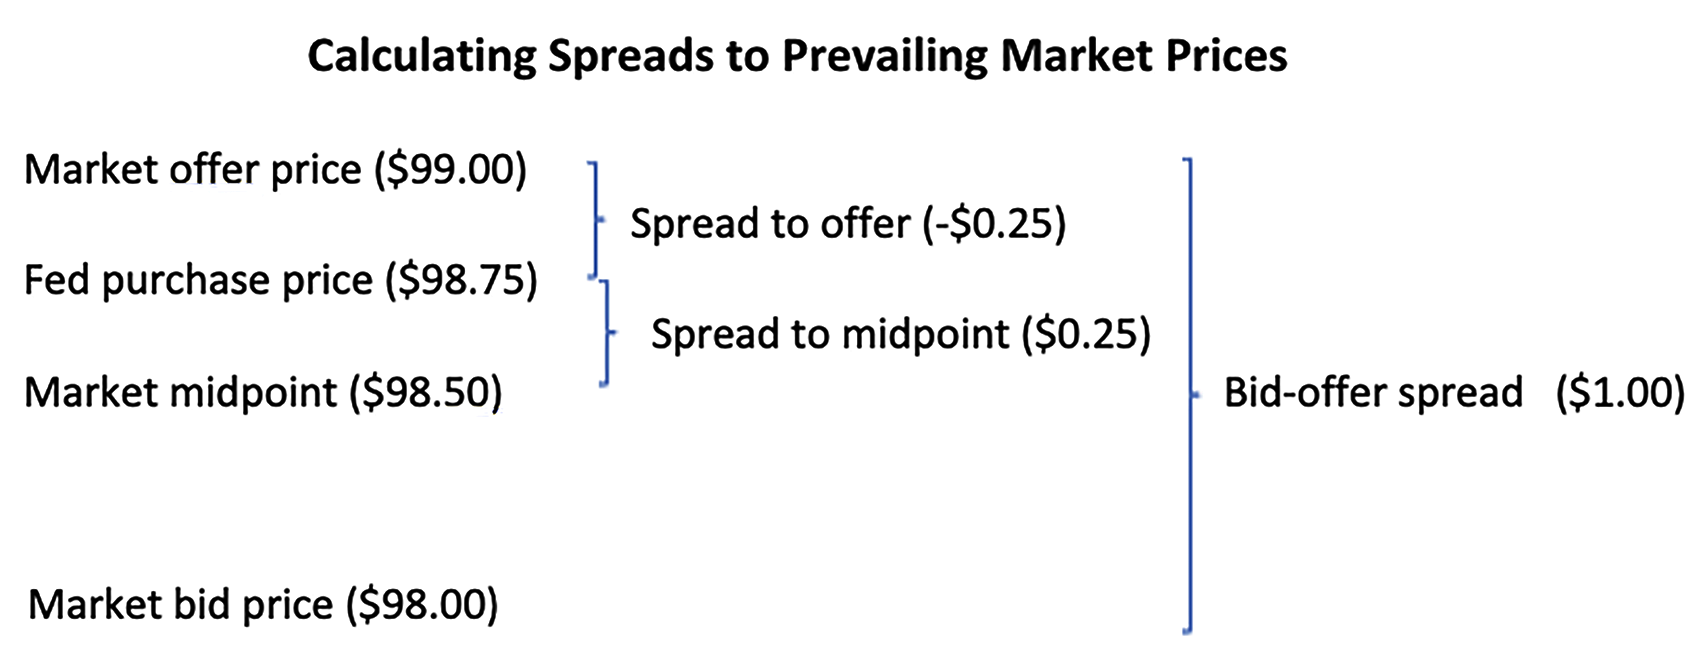
A stylized example of our approach is shown in the diagram below. In the example, the prevailing market bid and offer prices of a security included in a purchase operation are $98 and $99, respectively, per $100 par. It follows that the market midpoint price is $98.50. In the example, the Fed purchases the security at a price of $98.75, between the market offer and midpoint prices (consistent with what actually happened in 2020). We calculate the spread to market offer as -$0.25 and the spread to market midpoint as $0.25. The difference between the spreads equals $0.50, or one-half of the $1 market bid-offer spread at the time.
Execution Quality Varies Across Purchase Programs
The chart below plots average spreads to offer and spreads to midpoint across asset purchase programs. The blue bars show that the Fed has typically bought Treasury notes and bonds at prices close to the prevailing market offer price, on average, but that it bought securities at appreciably lower prices during the 2020 market functioning purchases. On average, the Fed bought securities at prices more than 4½ 32nds of a point cheaper than prevailing market offer prices (a point equals one percent of par), which corresponds to nearly 15 cents per $100 par.
Execution Quality of Market Functioning Purchases was Especially Good
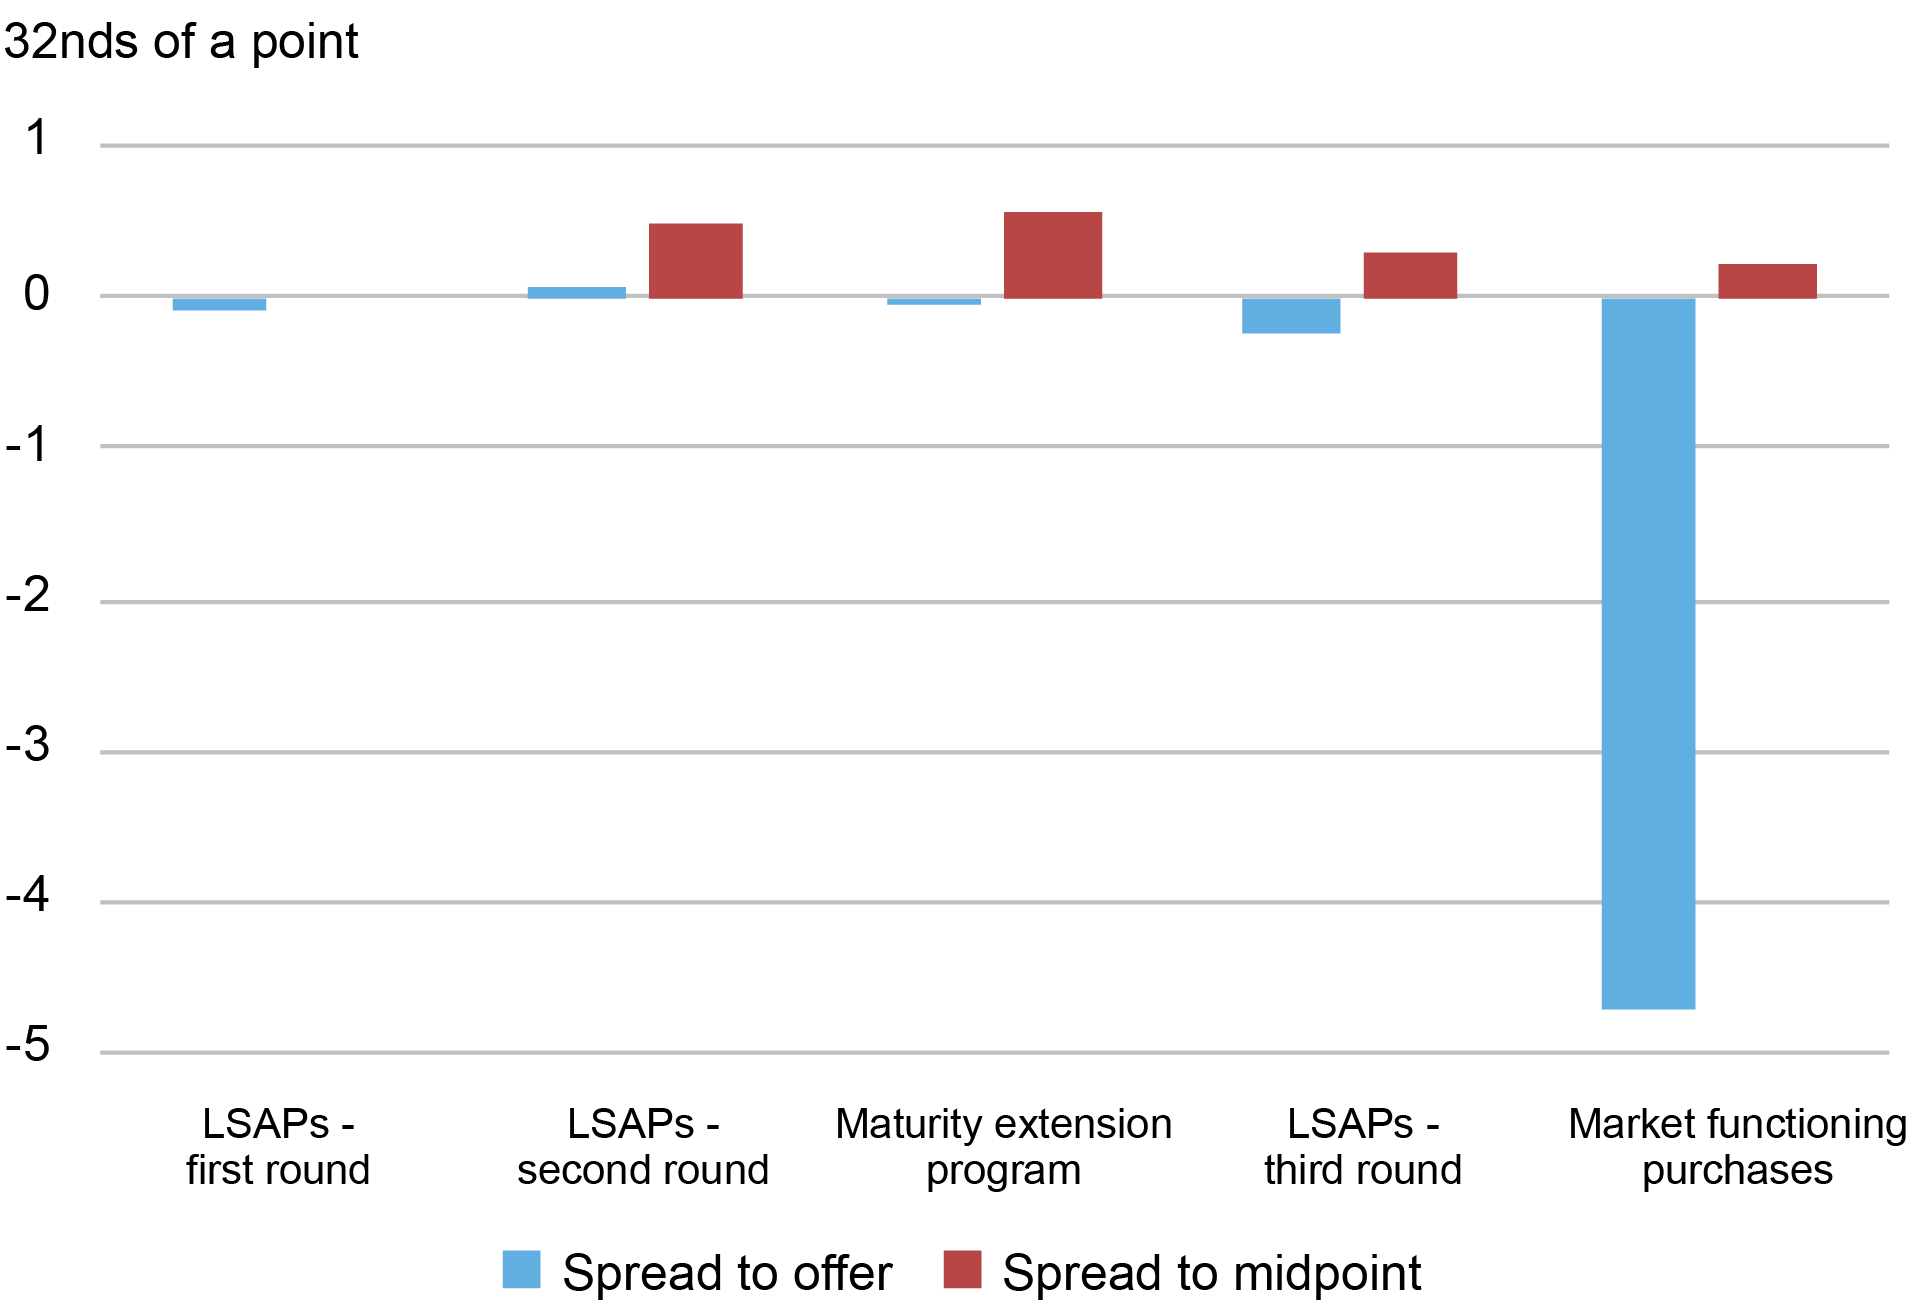
Notes: The chart plots the average volume-weighted spread between the Federal Reserve’s purchase price and the prevailing market offer or midpoint price for U.S. Treasury notes and bonds purchased in each of the indicated purchase programs. Negative values indicate purchase prices lower than market prices. Spread to midpoint is not reported for the first rounds of LSAPs due to data limitations. Market functioning purchases are limited to purchases in 2020. LSAPs = large-scale asset purchases.
The red bars, in contrast, show that on average the Fed has typically bought securities at prices somewhat worse than the midpoints between the prevailing market bid and offer prices. This was also the case with the 2020 market functioning purchases. Importantly, the only difference between the results represented by the blue and red bars is the market reference price, be it offer price (blue bars) or midpoint price (red bars). It follows that the large differences between the blue and red bars for the 2020 purchases reflect the unusually wide bid-ask spreads in the market at the time.
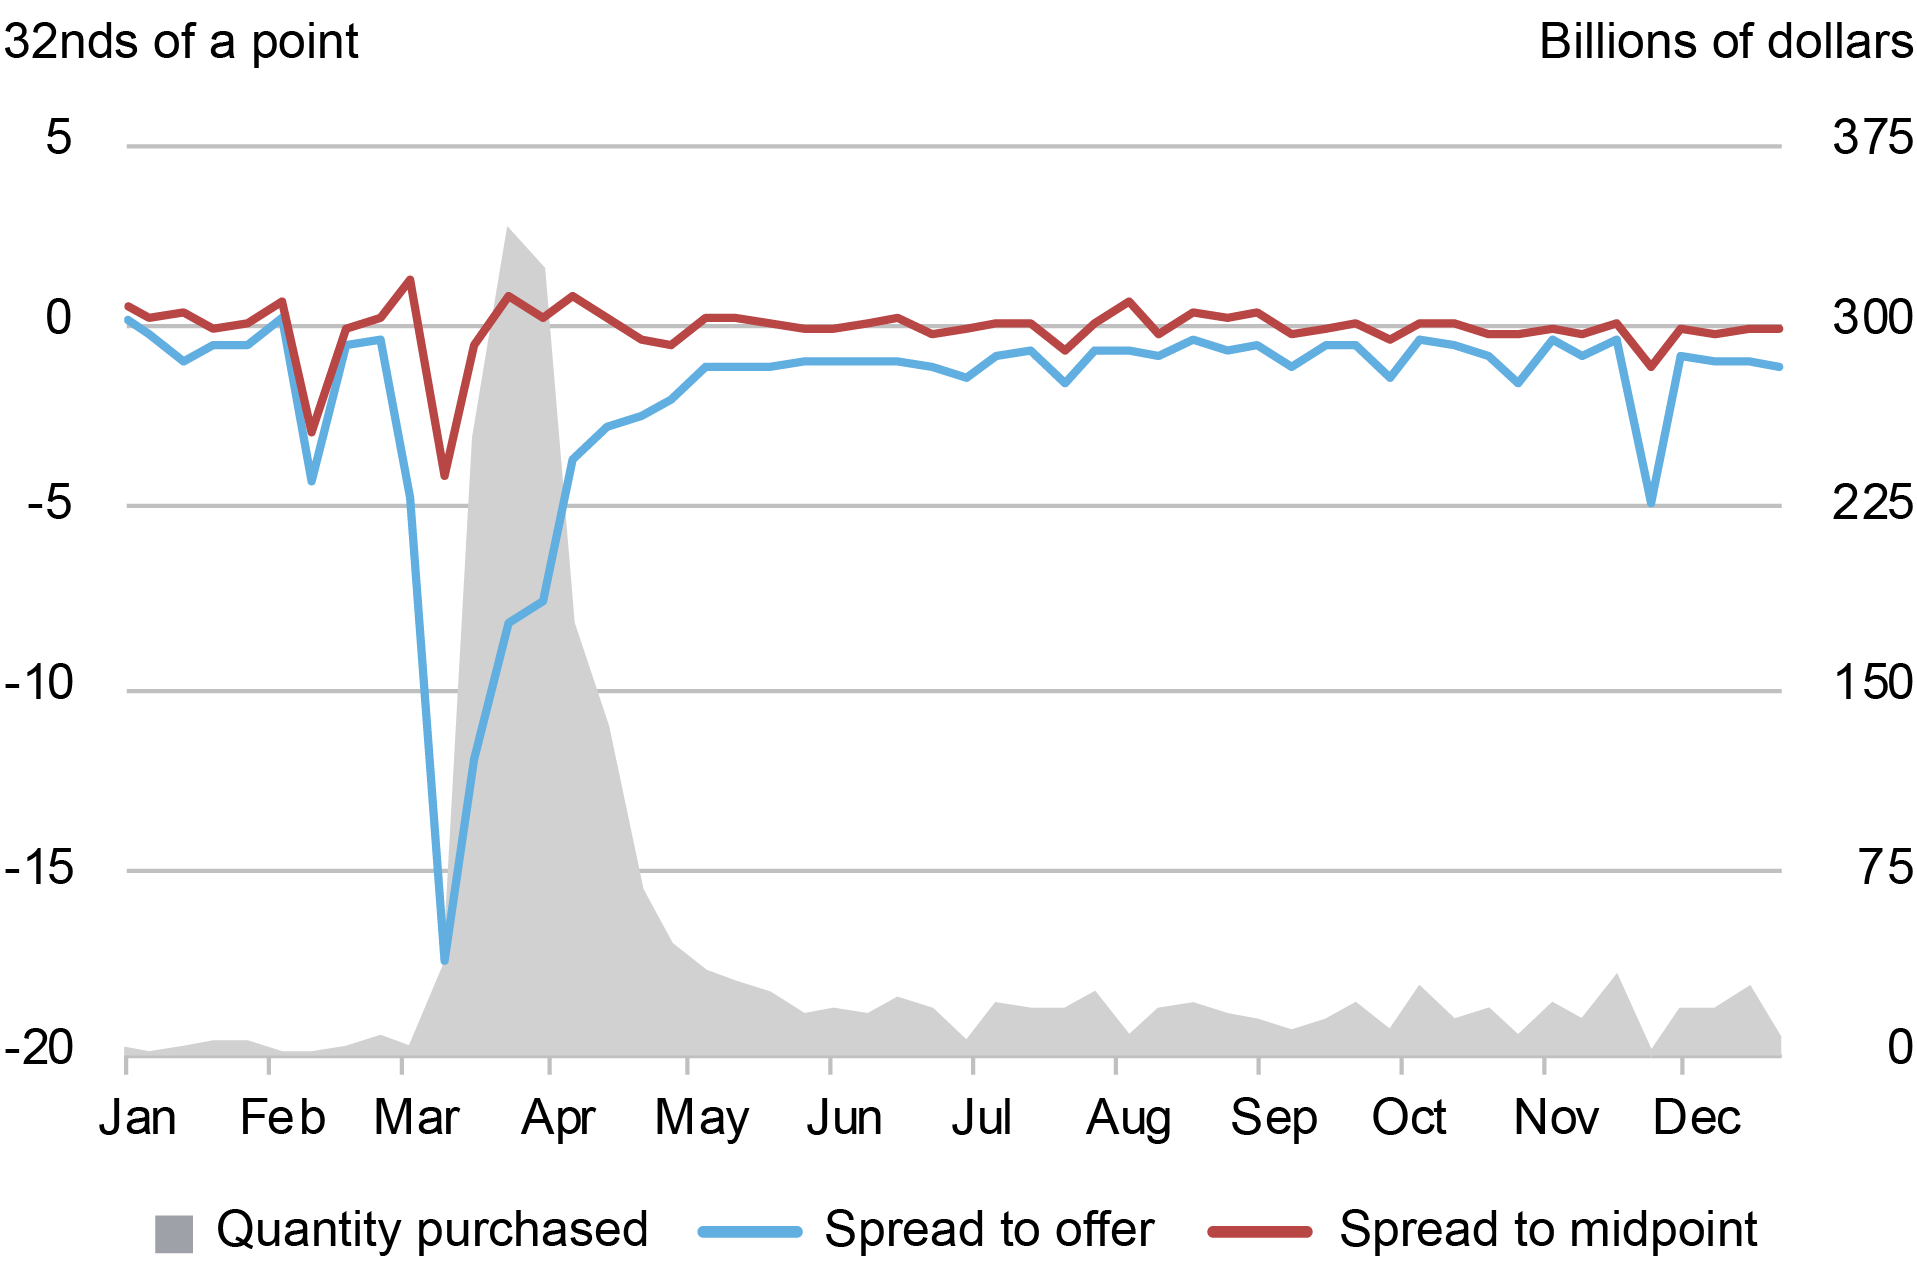
To delve into the execution quality of the market functioning purchases, the next chart plots the spread measures at a weekly frequency for 2020 only. The blue line shows that the Fed bought Treasury notes and bonds at prices well below prevailing market offer prices in March 2020 especially, when market dysfunction was at its worst and bid-ask spreads were at their widest. At a weekly level, these differences between Fed purchase prices and market offer prices reached 17 32nds of a point, on average, or more than 50 cents per $100 par. The shaded gray area shows that the Fed’s weekly purchases ramped up just as the spreads to offer prices widened and then moderated as the spreads normalized. The red line shows that the Fed’s purchase prices remained relatively close to market midpoint prices even in March 2020 when bid-ask spreads were at their widest.
Execution Quality was at its Best in March 2020
Notes: The chart plots the average volume-weighted spread between the Federal Reserve’s purchase price and the prevailing market offer or midpoint price as well as the quantity of the Federal Reserve’s purchases for U.S. Treasury notes and bonds purchased each week in 2020. Negative values indicate purchase prices lower than market prices.
The chart below shows how the execution quality of the Fed’s 2020 market functioning purchases differed across maturity buckets. Spreads to offer prices were especially large for long duration securities, averaging nearly 20 32nds of a point for the 20-30 year sector. Spreads to midpoint prices were close to zero across sectors. It follows that bid-ask spreads were appreciably wider for the long duration securities as one would expect. The findings add to the earlier evidence that the Fed was able to transact at prices close to the midpoints between the prevailing bid and offer prices despite the wide bid-ask spreads at the time.
Execution Quality was Best for Longer-Term Securities in Price Terms
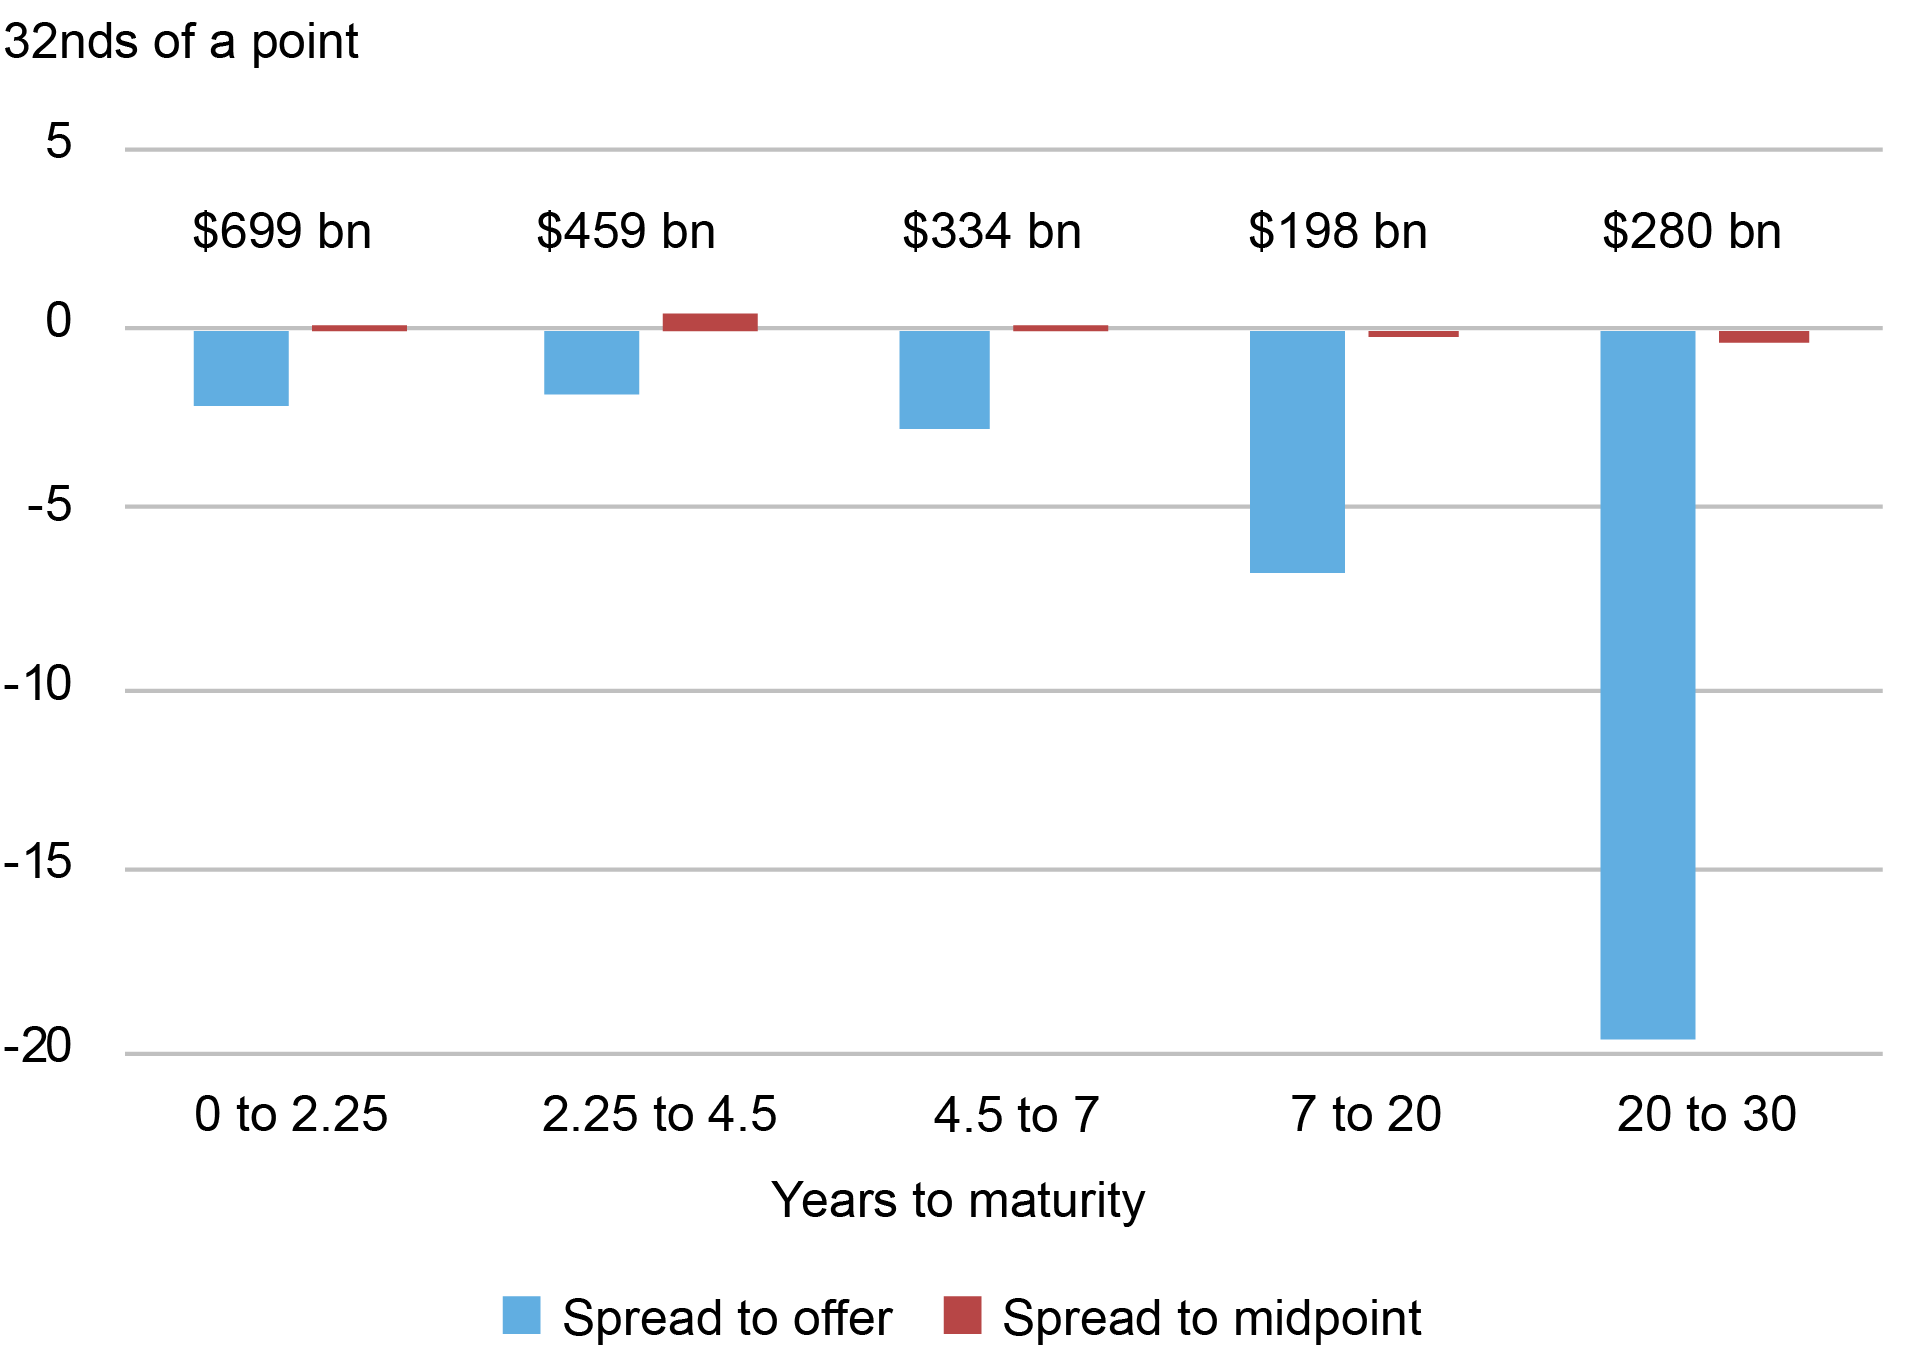
Notes: The chart plots the average volume-weighted spread between the Federal Reserve’s purchase price and the prevailing market offer or midpoint price by maturity sector for the 2020 market functioning purchases of U.S. Treasury notes and bonds. Negative values indicate purchase prices lower than market prices. Numbers above the bars indicate total purchase amounts in that sector in billions of dollars, par value.
Yields vs. Prices
Our analysis is mostly conducted in terms of prices, but the results generally hold qualitatively when done in terms of yields. That is, the Fed bought securities at especially attractive yields relative to offer yields during the 2020 market functioning purchases and in March 2020 in particular. Not surprisingly, the one difference in results concerns the comparison of execution quality by sector. In terms of yields, Fed purchases were unusually good in the shortest maturity sector, with purchase yields differing from prevailing market offer yields by 8 basis points on average, versus 1½ – 2½ basis points in the other sectors. That said, Fed purchase yields were close to the midpoints between prevailing market bid and offer yields across sectors, on average, again suggesting that differences in spreads to offers may have largely reflected differences in market bid-ask spreads.
Execution Quality was Best for Shorter-Term Securities in Yield Terms
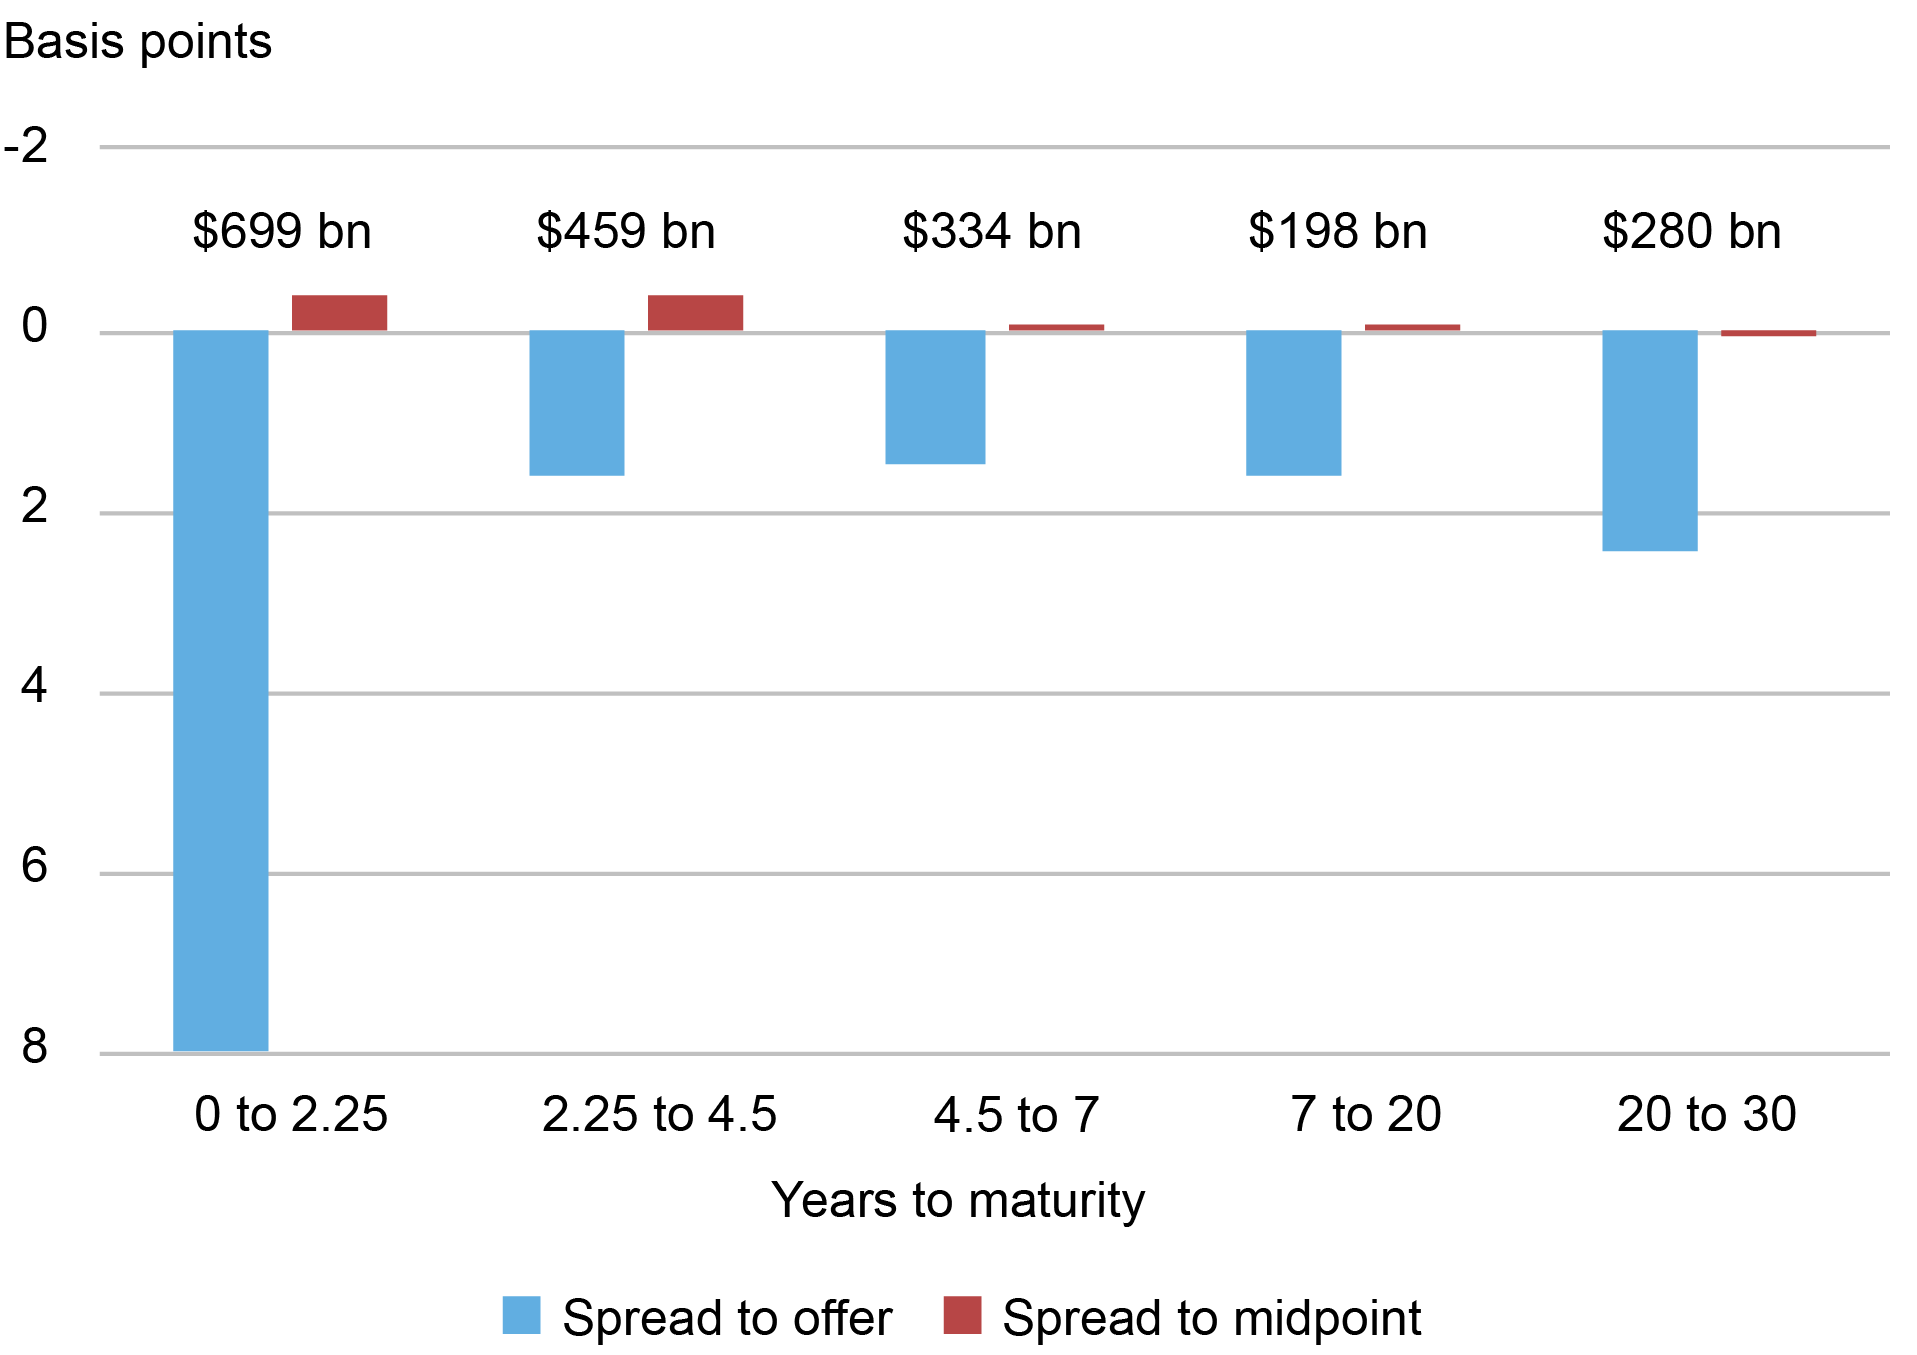
Notes: The chart plots the average volume-weighted spread between the Federal Reserve’s purchase yield and the prevailing market offer or midpoint yield by maturity sector for the 2020 market functioning purchases of U.S. Treasury notes and bonds. Positive values indicate purchase yields higher than market yields (that is, purchase prices lower than market prices). The y-axis is inverted so that bars dipping below the x-axis indicate savings to the Federal Reserve as with the preceding charts. Numbers above the bars indicate total purchase amounts in that sector in billions of dollars, par value.
Interpreting our Findings
How do we explain our findings that the Fed was able to buy Treasuries during the pandemic at prices lower than prevailing market offer prices? One possibility is that the Fed generally transacts at prices close to midpoint prices with the differences from market offer prices only being meaningful and easily discernible when bid-ask spreads are wide as they were during the pandemic. Trading with the Fed may expose dealers to less information risk than trading with customers, because dealers know that the Fed’s trades do not convey information about future trading flows or other expectations given the Fed’s protocol of announcing its trading plans and rationale in advance.
Another possibility is that there was something unique about the pandemic that led dealers to offer especially attractive prices to the Fed. Many investors sold Treasuries to raise cash quickly amidst the dash for cash of March 2020. Dealers offset many of the sales, but had high holdings going into the pandemic, as shown in this Economic Policy Review article, and had limited capacity to absorb the selling pressure amidst high volatility and poor liquidity (see also this Staff Report). Dealers may have hence been eager to sell Treasuries, but the question then arises as to why their inclination to sell would not have been reflected in market prices.
A possible explanation is that there was variation in dealers’ preferences to sell particular Treasuries, reflecting differences in their intermediation activities and hence inventories. Market prices may have reflected consensus views across dealers, with the Fed’s operations providing an opportunity for certain dealers to offload particular securities at prices that were both better than the dealers could find elsewhere amidst the wide bid-ask spreads, but still cheaper than the contemporaneous market prices. In normal times, by contrast, the market mechanism may efficiently reallocate securities across dealers so that any given dealer’s inclination to sell is roughly reflective of the market overall. How dealer characteristics may have affected the competitiveness of dealer offers during the Fed’s market functioning purchases is a promising area for future work.
A final consideration is that market price information was likely less reliable during the pandemic. Observed bid and offer prices are generally indicative for most Treasury securities and hence not necessarily reflective of the exact prices that customers pay. Indicative prices may have been less reliable in 2020 when market functioning was poor so that our estimates overstate or understate the prices the Fed paid relative to market prices. Another promising area of future work is to compare the Fed’s purchase prices to those of others around the same time to gauge whether, and the extent to which, the Fed’s execution quality surpassed that of other customers.

Ellen Correia Golay is a capital markets trading advisor in the Federal Reserve Bank of New York’s Markets Group.

Maximilian Dunn is a capital markets trading principal in the Federal Reserve Bank of New York’s Markets Group.

Michael J. Fleming is head of Capital Markets in the Federal Reserve Bank of New York’s Research and Statistics Group.

Peter Johansson is a capital markets trading principal in the Federal Reserve Bank of New York’s Markets Group.

At the time this post was written, Isabel Krogh was a research analyst in the Federal Reserve Bank of New York’s Research and Statistics Group. She is currently pursuing a master’s degree in financial mathematics at the University of Chicago.

Or Shachar is a financial research advisor in the Federal Reserve Bank of New York’s Research and Statistics Group.

At the time this post was written, Joshua Younger was an advisor in the Federal Reserve Bank of New York’s Markets Group.
How to cite this post:
Ellen Correia Golay, Maximilian Dunn, Michael J. Fleming, Peter Johansson, Isabel Krogh, Or Shachar, and Joshua Younger, “The Fed’s Treasury Purchase Prices During the Pandemic,” Federal Reserve Bank of New York Liberty Street Economics, July 8, 2025, https://libertystreeteconomics.newyorkfed.org/2025/07/the-feds-treasury-purchase-prices-during-the-pandemic/.
Disclaimer
The views expressed in this post are those of the author(s) and do not necessarily reflect the position of the Federal Reserve Bank of New York or the Federal Reserve System. Any errors or omissions are the responsibility of the author(s).