
In this post we examine changes in households’ beliefs following the release of the December 2024 SCE Public Policy Survey, finding large shifts in consumer expectations about future changes in fiscal policy. Households assign higher likelihoods to a variety of tax cuts and to reductions in a range of transfer programs, while they assign lower likelihoods to tax hikes and expansions in entitlement programs. We do not find these sharp changes translate into meaningful shifts in median households’ near-term expectations about the evolution of the overall economy, nor do they appear to have significantly affected median near-term expectations about the household’s own income and spending growth.
Households’ expectations about future economic developments play a key role in influencing their decisions and actions as consumers and workers, which in turn drive observed macroeconomic changes. A research area of growing interest is to study how expectations are formed and influenced by households’ experiences and major events. For example, election outcomes may affect consumer expectations for different reasons. They may influence beliefs about the economic and social policies a winning party is likely to implement and the effects of those policies, ranging from fiscal, trade, regulatory and immigration policies, on personal and macroeconomic outcomes. This outcome, and the associated removal of uncertainty about who will win, could also influence consumer optimism and emotions, and these effects are likely to depend in part on whether the person voted for the winning party.
Recent Shifts in Public Policy Expectations
We begin with an investigation into changes in consumer beliefs by directly examining households’ beliefs about future public policy changes. To do so, we draw on unique data collected in December 2024 from the SCE Public Policy Survey on their expectations for future changes in a wide range of government policies, including changes in tax rates and in the generosity of social programs. These data have been collected every four months since November 2015. We find dramatic shifts in consumers’ views about future tax and entitlement programs post-November 2024. The left panel of the chart below shows that the average probability survey participants assign to an increase, decrease, and no change in the income tax rate for the highest income bracket. The average perceived likelihood of a decrease in the income tax rate for the highest income bracket increased from 14.9 percent in August to 40.3 percent in December, the highest reading since April 2017. At the same time, the average probability of an increase in the income tax rate for the highest income bracket decreased from 40.6 percent in August to 19.4 percent in December, the lowest reading since April 2018. This shift is similar to that observed in 2016 and is opposite in direction to the change in 2020.
The right panel of the chart shows a similar increase in expectations of a future cut in the capital gains tax. The average perceived likelihood of a cut in the capital gains tax increased from 10.7 percent in August to 29.3 percent in December, the highest reading since April 2017. Meanwhile, the average likelihood assigned to an increase in the capital gains tax decreased from 37.1 percent in August to 22.6 percent in December. Interestingly, respondents continue to assign close to a 50 percent chance to the capital gains tax rate remaining unchanged over the next year. As shown here, we find qualitatively similar shifts in expectations about other future tax changes: Respondents’ average likelihoods of decreases in the gasoline tax, the payroll tax, and the average income tax rate all increased sharply in December, while the average likelihood of increases in these taxes all decreased. The average probability assigned to an increase in the gasoline tax reached a new series low (since November 2015).
Consumers Report Increased Likelihood of Future Tax Cuts

Notes: The left panel shows the average probability respondents assign to a decrease, no change, and an increase in the tax on the highest income bracket over the next twelve months. The right panel shows these average probabilities for the expected change in the capital gains tax rate. Vertical dashed lines correspond to November 2016, November 2020, and November 2024, respectively.
The large post-November-2024 movement in expectations of future tax changes are accompanied by large shifts in expectations regarding future changes in entitlement programs. Generally, we see a move away from expectations of a future expansion toward expectations of future cuts in assistance programs. The left panel of the chart below shows such an increase in the average likelihood of a reduction in welfare benefits over the next year. The average perceived likelihood of a decline in federal welfare benefits increased from 13.8 percent in August to 40.8 percent in December, the highest reading since April 2017. The right panel of the chart shows a similar shift toward expectations of a reduction in federal student debt relief, increasing from an average likelihood of 14.8 percent in August to 39.8 percent in December, the highest reading since the start of the series in November 2015. We see very similar patterns for expected year-ahead changes in other entitlement programs, including social security benefits, unemployment benefits, housing assistance, paid parental leave, preschool education, federal student aid, and Medicare.
Consumers Increasingly Expect Future Cuts in Federal Assistance Programs
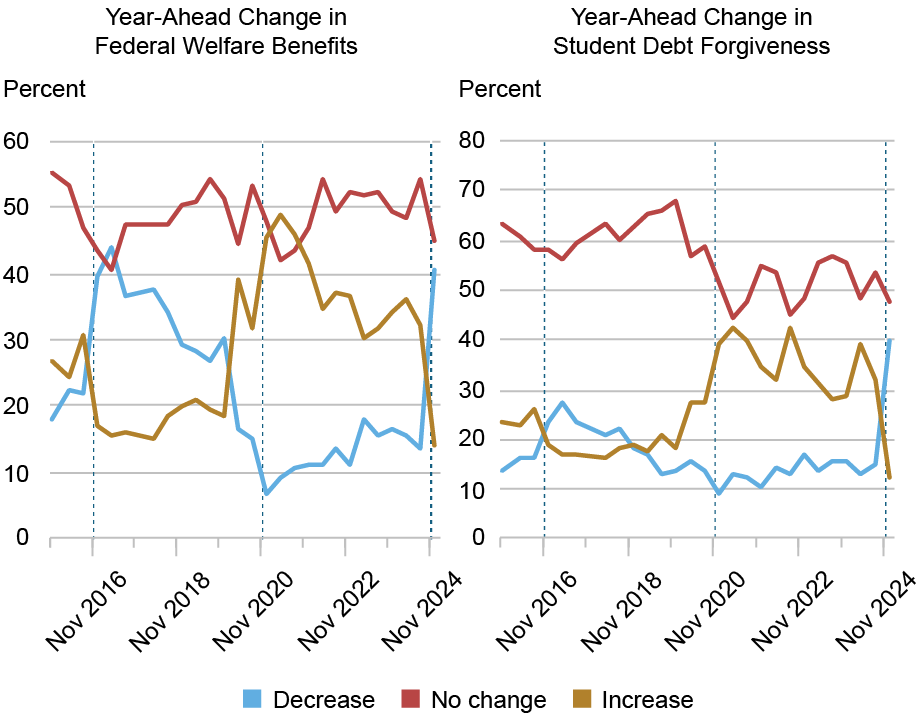
Notes: The left panel shows the average probability respondents assign to a decrease, no change, and an increase in federal welfare benefits over the next twelve months. The right panel shows these average probabilities for the expected change in federal student debt forgiveness. Vertical dashed lines correspond to November 2016, November 2020, and November 2024, respectively.
Consistent with the shift in beliefs regarding future public policy changes, in our monthly core Survey of Consumer Expectations (SCE), we find reductions in the average expected growth in year-ahead taxes respondents expect to pay (keeping income fixed) and in government debt. The median change in taxes respondents expect to have to pay twelve months from now (including federal, state and local income, property, and sales taxes), if their total household income were to stay the same as now, shows a clear shift down of 1 percentage point to 3.0 percent. Meanwhile the median expected increase in U.S. government debt over the next twelve months fell from around 8.5 percent in October to 5.9 percent in December.
How About Expectations for the Overall Economy and Household Finances?
In contrast, when considering a set of broader expectations regarding the overall economy, we see little evidence in our monthly core SCE of a meaningful shift in beliefs. More specifically, we see no or relatively small changes in expectations regarding future inflation, and changes in home prices, interest rates, and stock prices. The left panel of the chart below shows median inflation expectations over the one-year, three-year, and five-year horizons. We have seen little movement in these expectations in the December 2024 to February 2025 timeframe. The right panel of the chart similarly shows relatively stable home price growth expectations.
Consumers’ Outlook on the Aggregate Economy Has Been Stable
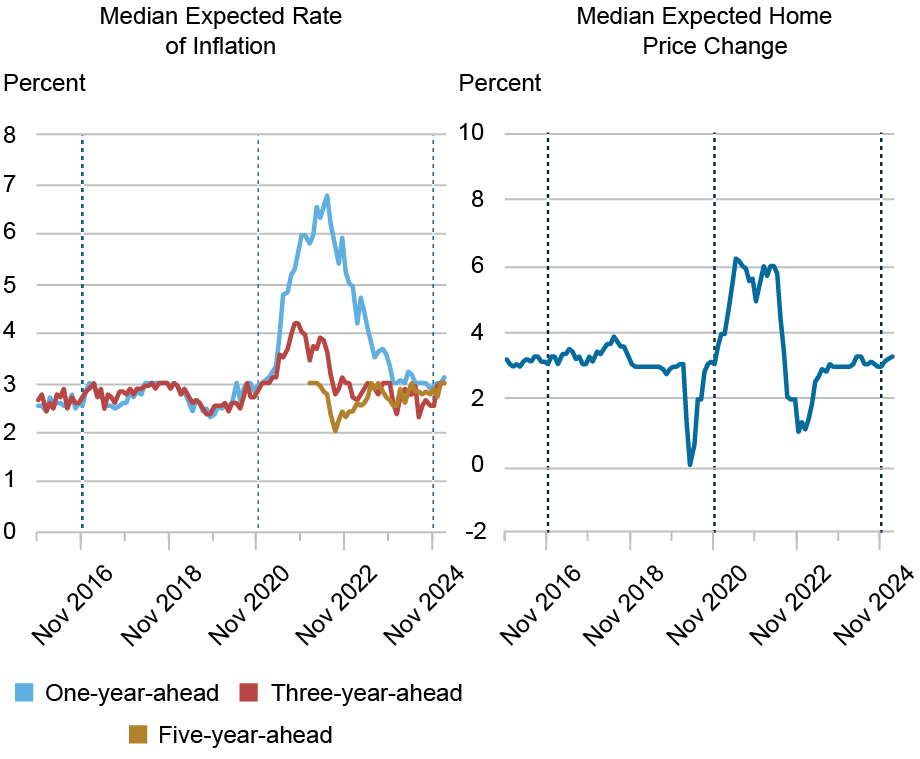
Notes: The left panel shows the median expected rate of inflation at the one-year-, three-year-, and five-year-ahead horizons. The right panel shows the median expected change in U.S. home prices over the next twelve months. Vertical dashed lines correspond to November 2016, November 2020, and November 2024, respectively.
We also see little evidence of meaningful shifts in a range of economic outcomes and behaviors related to respondents’ own households. The chart below shows relative stability in median year-ahead household income growth expectations (left panel) and median expected year-ahead household spending growth (right panel). The latter has been gradually tending down over the past year as indicated by the fitted trendline. Similarly, thus far in the core survey we have seen little change in median year-ahead earnings growth expectations.
Consumers’ Near-Term Expectations About Their Own Economic Outcomes Have Remained Steady
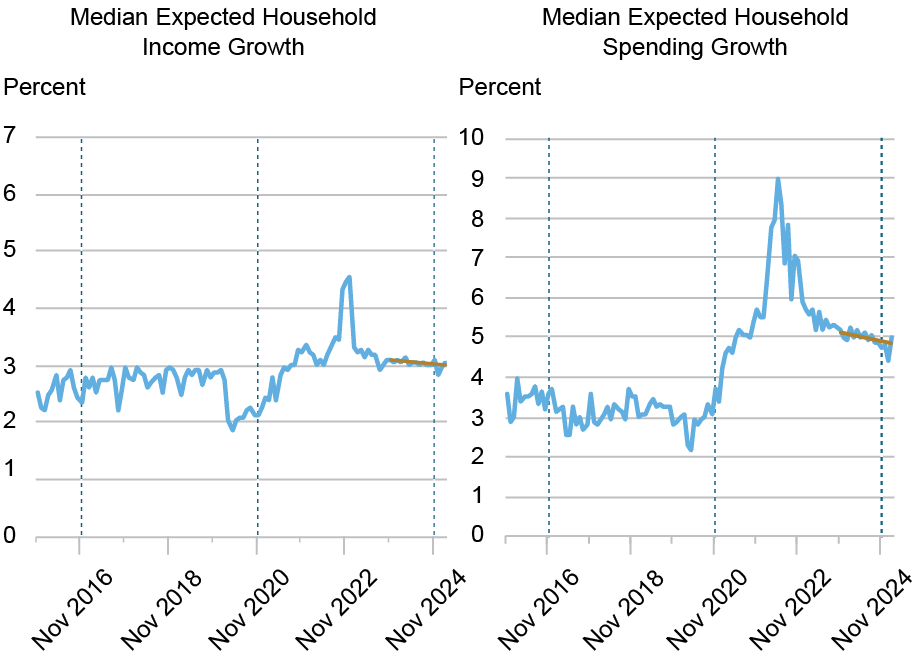
Notes: The left panel shows the median expected growth rate in household income over the next twelve months. The right panel shows the median expected growth rate in household spending over the next twelve months. Vertical dashed lines correspond to November 2016, November 2020, and November 2024, respectively. The orange lines show the fitted linear trends in both series estimated over the twelve months preceding November 2024.
Wrapping Up
We find large shifts in consumer expectations about future public policy changes in recent months. Households on average assign higher likelihoods to a variety of tax cuts and to reductions in a range of assistance and social insurance programs. Despite these sharp changes in government policy beliefs, we have not seen significant changes in expectations on aggregate economic outcomes, nor changes in median near-term expectations of households’ own income and spending. Stay tuned for the next release of the SCE Public Policy Survey in May 2025.

Joseph Delehanty is a research analyst in the Federal Reserve Bank of New York’s Research and Statistics Group.

Gizem Kosar is an economic research advisor in the Federal Reserve Bank of New York’s Research and Statistics Group.

Wilbert van der Klaauw is an economic research advisor in the Federal Reserve Bank of New York’s Research and Statistics Group.
How to cite this post:
Joseph Delehanty, Gizem Kosar, and Wilbert van der Klaauw, “Recent Shifts Seen in Consumers’ Public Policy Expectations,” Federal Reserve Bank of New York Liberty Street Economics, April 11, 2025, https://libertystreeteconomics.newyorkfed.org/2025/04/recent-shifts-seen-in-consumers-public-policy-expectations/.
Disclaimer
The views expressed in this post are those of the author(s) and do not necessarily reflect the position of the Federal Reserve Bank of New York or the Federal Reserve System. Any errors or omissions are the responsibility of the author(s).